Download
1 / 14
140 likes | 151 Views
Research Article (Industrial Engineering).

E N D
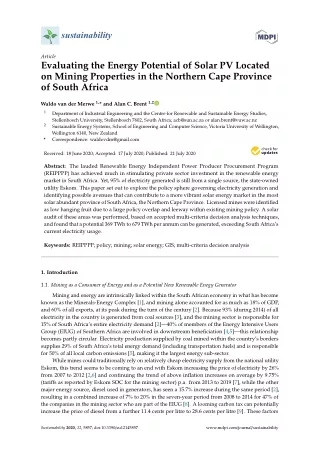
sustainability Article Evaluating the Energy Potential of Solar PV Located on Mining Properties in the Northern Cape Province of South Africa Waldo van der Merwe1,* and Alan C. Brent1,2 1 Department of Industrial Engineering and the Centre for Renewable and Sustainable Energy Studies, Stellenbosch University, Stellenbosch 7602, South Africa; acb@sun.ac.za or alan.brent@vuw.ac.nz Sustainable Energy Systems, School of Engineering and Computer Science, Victoria University of Wellington, Wellington 6140, New Zealand Correspondence: waldovdm@gmail.com 2 * ?????????? ??????? Received: 18 June 2020; Accepted: 17 July 2020; Published: 21 July 2020 Abstract: The lauded Renewable Energy Independent Power Producer Procurement Program (REIPPPP) has achieved much in stimulating private sector investment in the renewable energy market in South Africa. Yet, 95% of electricity generated is still from a single source, the state-owned utility Eskom. This paper set out to explore the policy sphere governing electricity generation and identifying possible avenues that can contribute to a more vibrant solar energy market in the most solar abundant province of South Africa, the Northern Cape Province. Licensed mines were identified as low hanging fruit due to a large policy overlap and leeway within existing mining policy. A solar audit of these areas was performed, based on accepted multi-criteria decision analysis techniques, and found that a potential 369 TWh to 679 TWh per annum can be generated, exceeding South Africa’s current electricity usage. Keywords: REIPPPP; policy; mining; solar energy; GIS; multi-criteria decision analysis 1. Introduction 1.1. Mining as a Consumer of Energy and as a Potential New Renewable Enegy Generator Mining and energy are intrinsically linked within the South African economy in what has become known as the Minerals-Energy Complex [1], and mining alone accounted for as much as 18% of GDP, and 60% of all exports, at its peak during the turn of the century [2]. Because 93% (during 2014) of all electricity in the country is generated from coal sources [3], and the mining sector is responsible for 15% of South Africa’s entire electricity demand [2]—40% of members of the Energy Intensive Users Group (EIUG) of Southern Africa are involved in downstream beneficiation [4,5]—this relationship becomes partly circular. Electricity production supplied by coal mined within the country’s borders supplies 29% of South Africa’s total energy demand (including transportation fuels) and is responsible for 50% of all local carbon emissions [5], making it the largest energy sub-sector. While mines could traditionally rely on relatively cheap electricity supply from the national utility Eskom, this trend seems to be coming to an end with Eskom increasing the price of electricity by 26% from 2007 to 2012 [2,6] and continuing the trend of above inflation increases on average by 9.75% (tariffs as reported by Eskom SOC for the mining sector) p.a. from 2013 to 2019 [7], while the other major energy source, diesel used in generators, has seen a 15.7% increase during the same period [2], resulting in a combined increase of 7% to 20% in the seven-year period from 2008 to 2014 for 47% of the companies in the mining sector who are part of the EIUG [8]. A looming carbon tax can potentially increase the price of diesel from a further 11.4 cents per litre to 28.6 cents per litre [9]. These factors Sustainability 2020, 12, 5857; doi:10.3390/su12145857 www.mdpi.com/journal/sustainability
Sustainability 2020, 12, x FOR PEER REVIEW 2 of 15 Sustainability 2020, 12, 5857 can potentially increase the price of diesel from a further 11.4 cents per litre to 28.6 cents per litre [9]. These factors all contribute to a market conducive to the adoption of alternative forms of energy, not for altruistic reasons, but driven purely by market forces. Solar photovoltaic (PV) seems the most likely candidate to succeed in the mining environment, due to it having one of the lowest prices per installed power unit, and it has one of the most predictable and steady power supply curves of the renewables stable, which is a good fit with the almost constant demand of mines. Furthermore, while South Africa has some of the world’s largest coal reserves, it pales in comparison to its solar resources, ranking together with Chile as having some of the highest solar insolation figures in the world [10,11]. Nowhere in the country is this as true as in the Northern Cape Province, and subsequently developers of utility-scale solar energy sources have overwhelmingly settled here first [12]. While the development of utility-scale projects, through the government Renewable Energy Independent Power Producer Procurement Program (REIPPPP), feeding the national grid has been an internationally lauded success [11], the uptake of renewables in other private sector markets has been lagging. Even after commissioning in excess of 2900 MW of renewable energy through privately funded projects worth US$13.1 billion (exchange rate of 15.37 ZAR:1 USD as per South African Reserve Bank data for the 1st quarter of the 2020 fiscal year) of investment [11], Eskom remains the largest generator of electricity in the country at 95%, through an installed capacity of 47 GW, of which 39 GW is from coal-based sources [13]. The government has also been slow with passing new policy to supplement the REIPPPP success, such as the proposed Independent System and Market Operator (ISMO) bill, which is meant to establish a single buyer and wholesale distributor of electricity, separate from Eskom [14]. 2 of 14 all contribute to a market conducive to the adoption of alternative forms of energy, not for altruistic reasons, but driven purely by market forces. Solar photovoltaic (PV) seems the most likely candidate to succeed in the mining environment, due to it having one of the lowest prices per installed power unit, and it has one of the most predictable and steady power supply curves of the renewables stable, which is a good fit with the almost constant demand of mines. Furthermore, while South Africa has some of the world’s largest coal reserves, it pales in comparison to its solar resources, ranking together with Chile as having some of the highest solar insolation figures in the world [10,11]. Nowhere in the country is this as true as in the Northern Cape Province, and subsequently developers of utility-scale solar energy sources have overwhelmingly settled here first [12]. While the development of utility-scale projects, through the government Renewable Energy Independent Power Producer Procurement Program (REIPPPP), feeding the national grid has been an internationally lauded success [11], the uptake of renewables in other private sector markets has been lagging. Even after commissioning in excess of 2900 MW of renewable energy through privately funded projects worth US$13.1 billion (exchange rate of 15.37 ZAR:1 USD as per South African Reserve Bank data for the 1st quarter of the 2020 fiscal year) of investment [11], Eskom remains the largest generator of electricity in the country at 95%, through an installed capacity of 47 GW, of which 39 GW is from coal-based sources [13]. The government has also been slow with passing new policy to supplement the REIPPPP success, such as the proposed Independent System and Market Operator (ISMO) bill, which is meant to establish a single buyer and wholesale distributor of electricity, separate from Eskom [14]. 1.2. Objective of the Paper 1.2. Objective of the Paper The objective of this paper is to evaluate the potential, in terms of energy extraction, of the land licensed to the mining industry in the Northern Cape Province of South Africa. This is quantified in terms of a simulated audit of the solar energy potential and qualified within the policy framework that exists currently within the mining and energy sectors. Section 2 describes the steps followed to achieve each sub-objective as described in Figure 1 below. The research literature review covers the first two sub-objectives. All the studies found to be relevant to energy audits, which initially included a number of studies which included other technologies such as wind and biomass energy, were used to identify the first sub-objective. The next step was to exclude studies of other technologies and only focus on solar PV audits or where solar PV was included as part of a multi-technology audit. This was done to determine the specific framework used, down to the fine detail of selection criteria, in order to formulate a customized framework to apply to this research. Data gathering was achieved by assembling a database of all the resources used in the literature study and adding further studies to this which focus on locally relevant content. This was followed by exploratory fieldwork to obtain access to quality local data. Lastly, all of the above was applied practically to build and execute a model to input data and calculate meaningful information from it. To achieve this, additional research had to be done qualitatively outside of the literature study sphere in order to gain the required knowledge on the specialized subject of GIS systems. The objective of this paper is to evaluate the potential, in terms of energy extraction, of the land licensed to the mining industry in the Northern Cape Province of South Africa. This is quantified in terms of a simulated audit of the solar energy potential and qualified within the policy framework that exists currently within the mining and energy sectors. Section 2 describes the steps followed to achieve each sub-objective as described in Figure 1 below. The research literature review covers the first two sub-objectives. All the studies found to be relevant to energy audits, which initially included a number of studies which included other technologies such as wind and biomass energy, were used to identify the first sub-objective. The next step was to exclude studies of other technologies and only focus on solar PV audits or where solar PV was included as part of a multi-technology audit. This was done to determine the specific framework used, down to the fine detail of selection criteria, in order to formulate a customized framework to apply to this research. Data gathering was achieved by assembling a database of all the resources used in the literature study and adding further studies to this which focus on locally relevant content. This was followed by exploratory fieldwork to obtain access to quality local data. Lastly, all of the above was applied practically to build and execute a model to input data and calculate meaningful information from it. To achieve this, additional research had to be done qualitatively outside of the literature study sphere in order to gain the required knowledge on the specialized subject of GIS systems. Main objective: Calculate the energy potential of solar PV located on Northern Cape province mining properties Sub-objective 4: Develop procedures and perform calculation in an open- source environment to promote reproducibility Sub-objective 1: Identify the most suitable decision making system Sub-objective 2: Identify and analyse qualifying decision criteria Sub-objective 3: Gather the required data from public available sources Figure 1. Research objectives.
Sustainability 2020, 12, 5857 3 of 14 2. Literature Review and Model Design 2.1. Multi-Criteria Decision Analysis In the GIS-based (Geographic Information System) PV potential studies in literature, most authors use some form of Multi-Criteria Decision Analysis (MCDA) with weighted selection criteria, preceded with a Boolean filter to eliminate areas completely unsuitable, such as holy grounds or bodies of water. The weighted selection criteria take many forms. The most common method of assigning weights is the Analytical Hierarchy Process (AHP) [15] with variants, such as using fuzzy logic [16]. Two studies have combined the Eliminating Choice and Translating Reality (ELECTRE) method [17] with their MCDA, and another used the Technique for Order Preference by Similarity to Ideal Solution (TOPSIS) method [18]. One of the most interesting cases was by Borgogno Mondino et al. [19], who trained an Artificial Neural Network (ANN) in what the conditions around existing solar plants in the investigated area are and let it come up with the criteria and associated weights for the MCDA itself. Five studies [20–24] used Boolean logic as the basis of their MCDA. The latter two of these five did not explicitly specify their MCDA as using Boolean logic, but this could be inferred after a careful look at their methodology. A specific type of MCDA, known as an Environmental Decision Support System (EDSS) [25], requires large amounts of spatial information to facilitate the decision-making process, as well as visualizing the results. It is for this reason that GIS systems are such a good match for this customized type of MCDA. 2.2. External Influence on Model Design This study differs from those in the literature on one specific point. Where those studies attempted to classify a large area according to suitability, this study was limited to very specific smaller areas, or pockets, due to pre-determined criteria. This flows from the decision to limit the study area to licensed mines in the Northern Cape Province of South Africa. This allowed for some generalization of many of the criteria, which will be detailed in the following sections, but for the purpose of the MCDA, it had the consequence of allowing the MCDA to be vastly simplified to that of Boolean choices only. 2.3. Model Criteria Selection The Northern Cape Province was deliberately chosen as the starting point of the study, as this province can be generalized in terms of solar radiation in exactly the way that the geographic regions of the literature could not. If the nine provinces of South Africa were to be ranked on average solar radiation received, including quality, then this province would be ranked the best [26]. In addition, it would not be meaningful to use a ranking system to order the different mining areas on solar insolation, as the objective is to reveal the collective solar insolation that these areas hold. Additionally, if it is assumed that the majority of mines must have some type of road or rail infrastructure in place to haul equipment and people to the mine and extract ore from the mine, then there is no reason to build in weighted criteria to exclude areas far away from roads. The same argument can be applied to electricity infrastructure given the energy intensity of mines, and the finding that all the mines investigated as part of the study by Votteler & Brent [27] were connected to the grid. Lastly, it can also be assumed with relative confidence that mining rights would not be granted for a specific area if that area contained any known historical landmarks, paleontological significant sites, archaeological sites, and protected wildlife sanctuaries. The remaining exclusions that were included in the model were the following: Rivers (not including dry riverbeds) Areas where the defined mining area included a portion of the ocean along a coastline. Farm sheds Farm housing Mining housing • • • • •
Sustainability 2020, 12, 5857 4 of 14 Mining machine sheds Open grooved mines Mine earth dumps (if discernible) National and regional tarred roads Airfields Railway tracks • • • • • • These exclusions were all identified manually through human input due to a lack of consistency in the datasets at hand. Inclusion was based on a system of positive identification, which implies that the final result for net insolation might not represent the worst-case scenario. On the other side of the spectrum are items that can also be positively identified but were deliberately not included as exclusions. These are: Gravel/sand roads Agricultural activity • • These were seen as non-permanent and can be rerouted or removed without a significant cost compared to the overall cost of development. Furthermore, as agriculture does not alter or change the landscape topography dramatically, it would not be something that poses a great limitation to a developer. Figure 2 shows an example of the identified exclusions for one specific mining area. Sustainability 2020, 12, x FOR PEER REVIEW 5 of 15 Figure 2. GID 97373 outline in black and identified exclusion areas in red. Figure 2. GID 97373 outline in black and identified exclusion areas in red. 2.4. Model Application When unfolding a three-dimensional sphere like earth onto a two-dimensional piece of paper, there will inevitably be some type of distortion. An example is the manner in which the Mercator projection distorts the size of the land area in an attempt to preserve shape. Equal area projections, on the other hand, distort shape while preserving area. The equal area projection selected is from the conical family of projections named Albers, having the characteristic that visual distortion is limited between the so-called standard parallels, which means that an Albers projection can be adapted to a localized area in order to be accurate while also having nearly no distortion when compared to a Mercator projection in that same area. The South African Albers NGI Aerials (reported to have 0.001% error when reporting projected area compared to actual area (source: Waywell, T. The effect of various map projections on surface area. PositionIT, 2009)) projection is exactly customized for this
Sustainability 2020, 12, 5857 5 of 14 Slope and Aspect Manyofthestudiesinliteraturenotethatthereisnodefinitenumberatwhichaslopeisconsidered to be unfeasible to build a utility-scale PV plant, as opposed to what is the case for concentrating solar power (CSP). This caused the studies to have a wide range of cut-off values beginning as low as 3% (commonly including 5%, 10% and 15%) up to 30% and even 50%. When slope was combined with an aspect, there were usually two numbers, such as 3% for north facing land (the majority of the studies are northern hemisphere based) and 5% for south facing land, therefore including the factor that south facing land is more preferable to north facing land in the northern hemisphere. This is in line with findings of studies such as that of Le Roux [28] studying the optimal tilt angle of solar panels for local South African conditions, which implies that a tilted solar panel (north aspect) is preferred to a flat panel as one moves further south of the equator. By extension, this implies that a greater amount of leeway should be allowed for naturally north aspect sloping ground. To this end, a cut-off of three per cent was chosen, while for slopes with a northern aspect (being defined as from 315◦to 45◦) the limit was increased to five per cent. 2.4. Model Application When unfolding a three-dimensional sphere like earth onto a two-dimensional piece of paper, there will inevitably be some type of distortion. An example is the manner in which the Mercator projection distorts the size of the land area in an attempt to preserve shape. Equal area projections, on the other hand, distort shape while preserving area. The equal area projection selected is from the conical family of projections named Albers, having the characteristic that visual distortion is limited between the so-called standard parallels, which means that an Albers projection can be adapted to a localized area in order to be accurate while also having nearly no distortion when compared to a Mercator projection in that same area. The South African Albers NGI Aerials (reported to have 0.001% error when reporting projected area compared to actual area (source: Waywell, T. The effect of various map projections on surface area. PositionIT, 2009)) projection is exactly customized for this purpose, and as such this was the de facto projection favored in all calculations unless otherwise stated in the research. 2.4.1. Solar Resource Data Solar resource maps can be created from mainly two sources: ground measurements, and satellite- derived data. The latter typically covers very large areas and are, therefore, suitable to exploratory work, and the datasets available usually offer much longer time periods, which alleviates at least some investor fears, as solar plants are built to be operated for decades. For ground measurements, a measurement device, such as a pyranometer or a pyrheliometer is required. Both these devices are extremely accurate, but as a consequence, are also very expensive. They also require deployment in many locations and this, combined with the high cost, makes it understandable why Fluri [29] reported only 11 weather stations, managed by the South African Weather Services (SAWS), equipped with such devices. For the purposes of this study, a satellite-derived solar resource map was best suited and the available solar resource maps for South Africa are discussed by three papers [29–31] in the local context with a summary of these given in Table 1. Only the NASA dataset was found to grant access to the full raw dataset before any variables are included through manipulations in an unknown software environment.
Sustainability 2020, 12, 5857 6 of 14 Table 1. Various sources of solar maps relevant to local conditions (Source: Fluri [29], Zawilska et al. [30], Winkler et al. [31]). Map Name Author Year Availability Data Source Solar radiation data handbook for Southern Africa Ground measurements - 1990 - South African Renewable Energy Resource Database Ground measurements CSIR, Eskom, DME 1999 Public Solar and Wind Energy Resource Assessment (SWERA) USDE, NREL & DLR 2006 Public Satellite Surface Meteorology and Solar Energy (NASA SMSE or SSE) NASA 2008 Public Satellite Photovoltaic Geographical Information System European Commission Joint Research Centre 2007 Public Satellite Satellite & ground measurements Meteonorm. Meteotest AG. 2009 Commercial SolarGIS. Solargis. - Commercial - 3Tier. Vaisala. - Commercial - 2.4.2. Data Sources According to Regulation 2, sub-section (2), paragraph (f) of the Mineral and Petroleum Resources Development Regulations, as enacted by the Mineral and Petroleum Resources Development Act (2002) [32,33], to obtain a mining permit the application should include a plan that includes “the boundaries of the land to which the application relates.” Within data sourced from the Directorate: National Geo-Spatial Information (NGI), a branch of Department of Rural Development and Land Reform, data defining these boundaries were found and assumed to be the verified product of the above-mentioned requirement. In general, a preference was enforced for publicly available data in order to promote reproducibility and, therefore, it was not only the mining boundary data, but also the aerial photographs and topographical data, sourced from the NGI. 2.4.3. Simulation Tool The seat-cost for GIS work in the academic community is prohibitive [34], especially in the African context, and for this reason, open-source software was considered a prerequisite. Since the start of the millennium, the uptake of R [35] (R is a free software environment for statistical computing and graphics) in the underfunded teaching and research sphere of developing countries has been noticeably high [36]. Bivand [36] reported in 2006 that a search on the R website for the term “spatial” yielded 1219 results, which was considerably more than the 447 results during the year of 2002. Repeating this in 2018 yielded 7280 results. On recommendation by Endel and Filzmoser [37], RStudio was selected as the preferred graphical user interface. The basic R distribution is capable of computing mathematical and statistical data functions as reported by Grunsky [38], but to perform true GIS operations extra libraries need to be installed. A summary of these is given in Table 2.
Sustainability 2020, 12, 5857 7 of 14 Table 2. Summary of all additional libraries added to the base R. Library Author cleangeo dplyr gstat maptools sp raster rgdal rgeos Blondel (2017) [39] Wickham & Francois (2016) [40] Graler et al. (2016) [41] Bivand & Lewin-Koh (2017) [42] Pebesma & Bivand (2005) [43] Hijmans (2016) [44] Bivand et al. (2016) [45] Bivand & Rundel (2017) [46] 2.4.4. Data Manipulation and Calculations The requirement to exclude areas exceeding a pre-determined slope limit creates the need for datasets that include data for both aspect and slope. A digital elevation model (DEM) is merely a raster object with each cell containing a single value: height. Interpolation provides a way of assigning values to these areas that exist between two topographical lines. In general, nearby data is selected with a weighted average to calculate the missing values at a given location. According to Babak and Deutsch [47], there are two main branches of interpolation. Either a statistical criterion can be used to select the nearby weighted values, or a simpler deterministic method can be used. For the former, techniques such as kriging (including but not limited to: simple-, ordinary-, universal- and simple cokriging) can be implemented, while for the latter, inverse distance weighted (IDW) interpolation is the most commonly implemented technique. IDW especially takes advantage of the principle of spatial autocorrelation, which assumes that values closer to the missing value should be more similar to it than values that are far away [48]. Simply stated, when taking one step away from your current position on earth, you never really find yourself in a very different state (with the exception of stepping over a cliff). The implementation of this is based on assigning a higher weight to points that are closer [47] or, as the name suggests, using the inverse distance. Thefunctionrequirestheusertochoosebetweentwotechniques, namely: Fleming&Hoffer, orHorn. A thorough comparison of these two techniques was made by Jones [49] who found that Fleming & Hoffer performed better for smooth surfaces, and Horn performed better for noisy surfaces. Jones [49] warns that when topographical lines are digitized and converted to a DEM through interpolation, it might create step artefacts, and thus Horn was selected. Figure 3 shows the intermediate steps toward calculating the aspect and slope data. In Figure 3a,b the original cropped topographical data is shown next to the same data that has been converted from lines to points. Below that Figure 3c shows what the result of the interpolation process looks like. The aspect and slope plots are shown in Figure 3d,e, respectively. It should be noted that the values for aspect are seemingly random, or noisy, in areas that are not close to the original topographical lines.
Sustainability 2020, 12, 5857 8 of 14 Sustainability 2020, 12, x FOR PEER REVIEW 8 of 15 (a) (b) (c) Figure 3. Cont.
Sustainability 2020, 12, 5857 Sustainability 2020, 12, x FOR PEER REVIEW 9 of 14 9 of 15 (d) (e) Figure 3. (a) Original topographical data; (b) converted to point, or raster, data; (c) result of interpolation; (d) the slope and aspect data and (e), respectively. (d) the slope and aspect data and (e), respectively. Figure3. (a)Originaltopographicaldata; (b)convertedtopoint,orraster,data; (c)resultofinterpolation; 3. Results 3. Results The sum of the areas under investigation was calculated as being 2572 km2, which represents 0.69% of the total land area of the Northern Cape Province, with a combined net solar insolation of 12,057 GWh/day. Because the assessed areas vary wildly in size, the net insolation results also vary with the largest value for a single mine at 1,609,358 MWh/day, and the minimum a mere 2 MWh/day. The lower limit is typical of a licensed mining area that is smaller than average, combined with a high level of area utilization dedicated toward mining activities. To provide some insight, the results shown in Table 3 are summarized according to order of magnitude in a pseudo-logarithmic style. The majority of mines fall in the 10–100 GWh/day category, while the broader 1–100 GWh/day category holds the outright majority share. The sum of the areas under investigation was calculated as being 2572 km2, which represents 0.69% of the total land area of the Northern Cape Province, with a combined net solar insolation of 12,057 GWh/day. Because the assessed areas vary wildly in size, the net insolation results also vary with the largest value for a single mine at 1,609,358 MWh/day, and the minimum a mere 2 MWh/day. The lower limit is typical of a licensed mining area that is smaller than average, combined with a high level of area utilization dedicated toward mining activities. To provide some insight, the results shown in Table 3 are summarized according to order of magnitude in a pseudo-logarithmic style. The majority of mines fall in the 10–100 GWh/day category, while the broader 1–100 GWh/day category holds the outright majority share. Table 3. Ranges of classification and total number of investigated areas within each. Table 3. Ranges of classification and total number of investigated areas within each. Classification Range Number of Areas Classification Range Number of Areas 0–10 MWh/day 10–100 MWh/day 100–1000 MWh/day 1–10 GWh/day 10–100 GWh/day 100–1000 GWh/day 1–10 TWh/day 3 7 18 27 33 21 4 0–10 MWh/day 10–100 MWh/day 100–1000 MWh/day 1–10 GWh/day 10–100 GWh/day 100–1000 GWh/day 1–10 TWh/day 3 7 18 27 33 21 4 These numbers should be understood in context, as this is far from the realistic levels of energy that can be expected to be evacuated. The factors that play the largest role were found to be panel efficiency and area-factor. From the literature, three studies [20,22,50] reported their applied panel efficiency, with values ranging between 8.8% and 37.9%. Only the study by Yushchenko et al. [51] reported ranges, which were mostly referenced to meta-studies on the subject at hand and can, therefore, be seen as the most reliable. The reported efficiencies were between 13.3% and 22% for monocrystalline cells and between 12% and 15.67% for polycrystalline cells. For this study, the simplest case was to assume a high and low case with values set at 12% and 22%, respectively, enveloping both aforementioned ranges. These numbers should be understood in context, as this is far from the realistic levels of energy that can be expected to be evacuated. The factors that play the largest role were found to be panel efficiency and area-factor. From the literature, three studies [20,22,50] reported their applied panel efficiency, with values ranging between 8.8% and 37.9%. Only the study by Yushchenko et al. [51] reported ranges, which were mostly referenced to meta-studies on the subject at hand and can, therefore, be seen as the most reliable. The reported efficiencies were between 13.3% and 22% for monocrystalline cells and between 12% and 15.67% for polycrystalline cells. For this study, the simplest case was to assume a high and low case with values set at 12% and 22%, respectively, enveloping both aforementioned ranges.
Sustainability 2020, 12, 5857 10 of 14 Area factors are an indication of what fraction of a specific area can be covered with panels since it is inevitable that space has to be left open between rows and mitigate shading and to leave room for service roads. The study of Gastli and Charabi [52] is the only one found that included an area factor of 0.7 when calculating electric power generation potential, and, therefore, in the absence of alternatives, this study proceeded with the same value. The formula utilized was similar to that implemented by Carrión et al. [24], and the adaptation used in this study is given by Equation (1): E = G × A × ε (1) where: E = Electric power generation per day (MWh/day) G = Solar radiation received (MWh/day) A = Area factor ε = Panel efficiency Table 4. summarizes the results after the effect of Equation (1) is included. Table 5 provides the headline numbers. Table 4. High and Low case after performing Equation (1) on Table 3. From Table 3 Low Case High Case 0 < 10 MWh/day 10 < 100 MWh/day 100 < 1000 MWh/day 1 < 10 GWh/day 10 < 100 GWh/day 100 < 1000 GWh/day 1 < 10 TWh/day Total 3 7 10 21 24 34 23 1 0 113 6 17 28 29 27 6 0 113 18 27 33 21 4 113 Table 5. Summary of headline values. Total Insolation-Gross [TWh/day] Total Insolation-Minus Exclusions [TWh/day] Energy Production-High Case [TWh/day] Energy Production-Low Case [TWh/day] 14.88 12.06 1.86 1.01 Finally, dispatchability remains the last link in the energy chain. Figure 4 shows the locations of where a broad selection of the REIPPPP projects are located. It is clear that solar resources are located in areas that were previously net receivers of energy, with the Northern Cape Province under-developed in terms of large-scale grid infrastructure. This disconnect between the locations of generation and consumption, in essence, is the reason why solar-generated power, at present, will not be able to satisfy the entire country’s electricity needs, even if the resource exceeds the demand.
Sustainability 2020, 12, 5857 Sustainability 2020, 12, x FOR PEER REVIEW 11 of 14 11 of 15 Figure 4. National electricity grid within the borders of South Africa. Solid lines show transmission lines of different carrying capacity. Black, red and yellow dots show current Eskom infrastructure (sub-stations) and purple dots around crosshairs show REIPPPP projects. (Source: Eskom Transmission Division [53]). Figure 4. National electricity grid within the borders of South Africa. Solid lines show transmission lines of different carrying capacity. Black, red and yellow dots show current Eskom infrastructure (sub-stations) and purple dots around crosshairs show REIPPPP projects. (Source: Eskom Transmission Division [53]). 4. Conclusions 4. Conclusions South Africa uses over 220 TWh of electricity annually [6], which is exceeded by even the low-case of 369 TWh per annum, and certainly by the high-case of 679 TWh per annum; implying that even on a worst-case base estimation, using only the identified mines to commission utility-scale solar PV plants, would satisfy the entire country’s electricity (energy, not power) demand requirements. To achieve this, the national grid would have to be reorganized. The fact that the national grid operator is also the single largest generator of coal-derived electricity is a major conflict of interest in achieving this goal and, again, highlights the importance of the need for the ISMO bill to be promulgated. However, depending on the interpretation of existing policy frameworks, opportunities exist to export energy after mine closures through the policies that govern environmental rehabilitation. This would open various permutations of co-ownership and commercial relationships between mining companies and solar energy developers. All the options that exist are dependent on either small policy changes, or leniency in execution. It would also require inter-departmental cooperation. This has already been proven successful between the Departments of Energy, Environmental Affairs and Water Affairs during the development and execution of the REIPPPP, and would only require a single department, the Department of Mineral Resources, to be aligned. Agile policy could also play a large role in load-generation matching by shifting or flattening peak load times through mechanisms such as time-dependent pricing strategies on the demand-side. On the generation-side, incorporating a favorable pricing strategy in the negotiated power purchase agreement (PPA) for supply during current peak times could allow the financial impetus required to make incorporated energy storage financially viable for energy developers, as in the widely publicized Tesla battery project in southern Australia [54]. In addition, investing in further South Africa uses over 220 TWh of electricity annually [6], which is exceeded by even the low- case of 369 TWh per annum, and certainly by the high-case of 679 TWh per annum; implying that even on a worst-case base estimation, using only the identified mines to commission utility-scale solar PV plants, would satisfy the entire country’s electricity (energy, not power) demand requirements. To achieve this, the national grid would have to be reorganized. The fact that the national grid operator is also the single largest generator of coal-derived electricity is a major conflict of interest in achieving this goal and, again, highlights the importance of the need for the ISMO bill to be promulgated. However, depending on the interpretation of existing policy frameworks, opportunities exist to export energy after mine closures through the policies that govern environmental rehabilitation. This would open various permutations of co-ownership and commercial relationships between mining companies and solar energy developers. All the options that exist are dependent on either small policy changes, or leniency in execution. It would also require inter-departmental cooperation. This has already been proven successful between the Departments of Energy, Environmental Affairs and Water Affairs during the development and execution of the REIPPPP, and would only require a single department, the Department of Mineral Resources, to be aligned. Agile policy could also play a large role in load- generation matching by shifting or flattening peak load times through mechanisms such as time- dependent pricing strategies on the demand-side. On the generation-side, incorporating a favorable pricing strategy in the negotiated power purchase agreement (PPA) for supply during current peak times could allow the financial impetus required to make incorporated energy storage financially
Sustainability 2020, 12, 5857 12 of 14 research into storage technologies, such as is currently the case between the government and private sector on a vanadium redox flow battery project [55], could help alleviate peaking supply problems and stimulate GDP growth by making South Africa a serious player in a global market where demand for storage solutions will only get bigger in the future. The own-consumption model is by far the simplest and presents the least number of variables to analyze in terms of its business sense to a company mainly concerned with profiting from mining activities. Possible variables can relate to the cost of obtaining a grid connection to a previously unconnected area or to avoid loss of services by an increasingly unstable grid utility. The first question should be whether enough reliable solar power can be generated, and this study found that the annual electricity generation potential varied between 36.5 GWh and 3650 GWh (100 MWh–10 GWh per day) for the majority of the mines analyzed. This compares favorably to the annual consumption per mine, reported as 4.2 GWh to 2752 GWh in the sample of the study by Votteler & Brent [27]. It was also found that the Acts regulating the mining industry and mining rights/permit holders provide the freedom to bring onto the land being mined any equipment and erecting any structure which is used for, or is incidental to, mining activities. While the final decision would be in the hands of the Minister, it can be stated that there should be no reason, insofar as generation potential or policy blockades, to prevent solar PV plant development for our own-consumption. Whether by own-consumption or as a grid supplier, market forces alone cannot guarantee uptake, leaving government policy as the largest common denominator that can halt or stimulate a vibrant privately funded solar energy market in the mining sector. Author Contributions: Conceptualisation, W.v.d.M.; Formal analysis, W.v.d.M.; Methodology, W.v.d.M.; Supervision, A.C.B.; Validation, W.v.d.M.; Writing—original draft, W.v.d.M.; Writing—review and editing, A.C.B. All authors have read and agreed to the published version of the manuscript. Funding: This research received no external funding. Conflicts of Interest: The authors declare no conflict of interest. References 1. Fine, B.; Rustomjee, Z. The Political Economy of South Africa: From Minerals-Energy Complex to Industrialisation; Witwatersrand University Press: Witwatersrand, South Africa, 1996. Boyse, F.; Causevic, A.; Duwe, E.; Orthoffer, M. Sunshine for Mines: Implementing Renewable Energy for off-Grid Operations; Carbon War Room: Washington, DC, USA, 2014. World Bank. Electricity Production from Coal Sources (% of Total) | Data 2018. Available online: https: //data.worldbank.org/indicator/EG.ELC.COAL.ZS?locations=ZA (accessed on 17 July 2018). EIUG. EIUG—Energy Intensive User Group of Southern Africa 2018. Available online: http://eiug.org.za/ (accessed on 17 July 2018). Baker, L. Governing electricity in South Africa: Wind, coal and power struggles. Gov. Clean Dev. 2011, 15, 1–27. Krupa, J.; Burch, S. A new energy future for South Africa: The political ecology of South African renewable energy. Energy Policy 2011, 39, 61–6254. [CrossRef] Eskom. Available online: http://www.eskom.co.za/CustomerCare/TariffsAndCharges/Pages/Tariff_History. aspx (accessed on 17 June 2020). Votteler, R.G. A Mining Perspective on the Potential of Renewable Electricity Sources for Operations in South Africa; Stellenbosch University: Western Cape, South Africa, 2016. BusinessTech. How SA’s New Carbon Tax will Affect Petrol and Electricity Prices. BusinessTech, 2018. Available online: https://businesstech.co.za/news/energy/218691/how-sas-new-carbon-tax-will-affect-petrol- and-electricity-prices/ (accessed on 22 July 2018). Parrado, C.; Girard, A.; Simon, F.; Fuentealba, E. 2050 LCOE projection for a hybrid PV-CSP plant in the Atacama Desert, Chile. Energy 2016, 94, 30–422. [CrossRef] Nakumuryango, A.; Inglesi-Lotz, R. South Africa’s performance on renewable energy and its relative position against the OECD countries and the rest of Africa. Renew. Sustain. Energy Rev. 2016, 56, 999–1007. [CrossRef] 2. 3. 4. 5. 6. 7. 8. 9. 10. 11.
Sustainability 2020, 12, 5857 13 of 14 12. Urban-Econ. Northern Cape Renewable Energy Strategy. 2013. Available online: https://urban-econ.com/ capabilities/energy/ (accessed on 27 October 2018). Eskom. Generation Plant Mix 2017. Available online: http://www.eskom.co.za/AboutElectricity/FactsFigures/ Documents/GX0001GenPlantMixRev19.pdf (accessed on 16 July 2018). Montmasson-Clair, G.; Ryan, G. Lessons from South Africa’s Renewable Energy Regulatory and Procurement Experience. J. Econ. Financ. Sci. 2014, 7, 26–507. [CrossRef] Saaty, T.L. The Analytic Hierarchy Process; Applications and Studies: Berlin, Germany, 1980. [CrossRef] Noorollahi, E.; Fadai, D.; Akbarpour Shirazi, M.; Ghodsipour, S. Land Suitability Analysis for Solar Farms Exploitation Using GIS and Fuzzy Analytic Hierarchy Process (FAHP)—A Case Study of Iran. Energies 2016, 9, 643. [CrossRef] Sánchez-lozano, J.M.; Henggeler, C.; García-cascales, M.S.; Dias, L.C. GIS-based photovoltaic solar farms site selection using ELECTRE-TRI: Evaluating the case for Torre Pacheco, Murcia, Southeast of Spain. Renew. Energy 2014, 66, 94–478. [CrossRef] Sánchez-lozano, J.M.; Teruel-solano, J.; Soto-elvira, P.L.; García-cascales, M.S. Geographical Information Systems (GIS) and Multi-Criteria Decision Making (MCDM) methods for the evaluation of solar farms locations: Case study in south-eastern Spain. Renew. Sustain. Energy Reviews 2013, 24, 56–544. [CrossRef] Borgogno Mondino, E.; Fabrizio, E.; Chiabrando, R. Site Selection of Large Ground-Mounted Photovoltaic Plants: A GIS Decision Support System and an Application to Italy. Int. J. Green Energy 2014, 12, 25–515. [CrossRef] Abed, M.; Nagasaka, K. Utility-scale implementable potential of wind and solar energies for Afghanistan using GIS multi-criteria decision analysis. Renew. Sustain. Energy Reviews 2017, 71, 60–150. [CrossRef] Jahangiri, M.; Ghaderi, R.; Haghani, A.; Nematollahi, O. Finding the best locations for establishment of solar-wind power stations in Middle-East using GIS: A review. Renew. Sustain. Energy Reviews 2016, 66, 38–52. [CrossRef] Merrouni, A.A.; Mezrhab, A.; Mezrhab, A. PV sites suitability analysis in the Eastern region of Morocco. Sustain. Energy Technol. Assess. 2016, 18, 6–15. [CrossRef] Domínguez, B.J.; García, C.X.; Pinedo, P.I. GIS approach to the definition of capacity and generation ceilings of renewable energy technologies. Energy Policy 2007, 35, 92–4879. [CrossRef] Carrión, J.A.; Espín, E.A.; Aznar, D.F.; Ridao, A.R. The electricity production capacity of photovoltaic power plants and the selection of solar energy sites in Andalusia (Spain). Renew. Energy 2008, 33, 52–545. [CrossRef] Rizzoli, A.E.; Young, W.J. Delivering environmental decision support systems: Software tools and techniques. Environ. Model. Softw. 1997. [CrossRef] Suri, M.; Cebecauer, T.; Skoczek, A. Cloud Cover Impact on Photovoltaic Power Production in South Africa. In Proceedings of the Southern African Solar Energy Conference, Port Elizabeth, South Africa, 5 February 2014. Votteler,R.G.; Brent,A.C.Aminingperspectiveonthepotentialofrenewableelectricitysourcesforoperations in South Africa: Part 2-A multi-criteria decision assessment. J. S. Afr. Inst. Min. Metall. 2017, 117, 299–312. [CrossRef] Le Roux, W.G. Optimum tilt and azimuth angles for fixed solar collectors in South Africa using measured data. Renew. Energy 2016, 96, 12–603. [CrossRef] Fluri, T. Solar Resource Mapping in South Africa; University of Stellenbosch: Western Cape, South Africa, 2009. Zawilska, E.; Brooks, M.J.; Meyer, A.J. A review of solar resource assessment initiatives in South Africa: The case for a national network. In Proceedings of the World Renewable Energy Forum (WREF 2012), Denver, CO, USA, 13–17 May 2012. Winkler, H.; Franke, B.; Eltrop, L.; Telsnig, T. How applicable are standard Solar Irradiation Maps? Insights from Case Studies. In Proceedings of the ISES-Europe Solar Conference, Opatija and Rejika, Croatia, 18–20 September 2012. Republic of South Africa. Mineral and Petroleum Resources Development Act; Government Gazette: Pretoria, South Africa, 2002. Department of Mineral Resources. A Guideline for a Mining Work Programme to be Submitted for a Applications for a Mining Right in Terms of the Minerals and Petroleum Resources Development Act; Department of Mineral Resources: Pretoria, South Africa, 2002. Bivand,R.;Gebhardt,A.ImplementingfunctionsforspatialstatisticalanalysisusingtheRlanguage. J. Geogr. Syst. 2000, 2, 17–307. [CrossRef] 13. 14. 15. 16. 17. 18. 19. 20. 21. 22. 23. 24. 25. 26. 27. 28. 29. 30. 31. 32. 33. 34.
Sustainability 2020, 12, 5857 14 of 14 35. R Core Team. R: A Language and Environment for Statistical Computing; R Foundation for Statistical Computing: Vienna, Austria, 2015. Bivand, R. Implementing Spatial Data Analysis Software Tools in R. Geogr. Anal. 2006, 38, 23–40. [CrossRef] Endel, F.; Filzmoser, P. R&GIS: Geospatial Plotting FFG IFEDH Project Student at Vienna University of Technology. IFAC Proc. Vol. 2012, 47, 1–6. [CrossRef] Grunsky, E.C. R: A data analysis and statistical programming environment-an emerging tool for the geosciences. Comput. Geosci. 2002, 28, 22–1219. [CrossRef] Blondel, E. Cleangeo: Cleaning Geometries from Spatial Objects. 2017. Available online: https://CRAN.R-project. org/package=cleangeo (accessed on 26 October 2018). Wickham, H.; Francois, R. Dplyr: A Grammar of Data Manipulation, Version 0.4; 2016. Available online: https://CRAN.R-project.org/package=dplyr (accessed on 25 October 2018). Graler, B.; Pebesma, E.; Heuvelink, G. Spatio-Temporal Interpolation using gstat. RFIE J. 2016, 8, 204–218. [CrossRef] Bivand, R.; Lewin-Koh, N. Maptools: Tools for Reading and Handling Spatial Objects, Version 0.8; 2017. Available online: https://CRAN.R-project.org/package=maptools (accessed on 24 October 2018). Pebesma, E.J.; Bivand, R. Classes and Methods for Spatial Data in R, Version 1.4-2; 2005. Available online: https://cran.r-project.org/doc/Rnews/ (accessed on 23 October 2018). Hijmans, R.J. Raster: Geographic Data Analysis and Modeling, version 2.8; 2016. Bivand, R.; Keitt, T.; Rowlingson, B. Rgdal: Bindings for the Geospatial Data Abstraction Library, Version 1; 2016. Available online: https://CRAN.R-project.org/package=raster (accessed on 22 October 2018). Bivand, R.; Rundel, C. Rgeos: Interface to Geometry Engine-Open Source (GEOS), Version 0.3; 2017. Available online: https://CRAN.R-project.org/package=rgeos (accessed on 21 October 2018). Babak, O.; Deutsch, C.V. Statistical approach to inverse distance interpolation. Stoch. Environ. Res. Risk Assess. 2008. [CrossRef] Setianto,A.; Triandini,T.ComparisonofKrigingandInverseDistanceWeighted(IDW)interpolationmethods in lineament extraction and analysis. J. Southeast Asian Appl. Geol. 2013, 5, 9–21. [CrossRef] Jones, K.H. A Comparison of Two Approaches to Ranking Algorithms Used to Compute Hill Slopes. GeoInformatica. GeoInformatica 1998, 2, 56–235. [CrossRef] Charabi, Y.; Gastli, A. PV site suitability analysis using GIS-based spatial fuzzy multi-criteria evaluation. Renew. Energy 2011, 36, 61–2554. [CrossRef] Yushchenko, A.; De Bono, A.; Chatenoux, B.; Kumar, M.; Ray, N. GIS-based assessment of photovoltaic (PV) and concentrated solar power (CSP) generation potential in West Africa. Renew. Sustain. Energy Rev. 2018, 81, 103–2088. [CrossRef] Charabi, Y.; Gastli, A. GIS assessment of large CSP plant in Duqum, Oman. Renew. Sustain. Energy Reviews 2010, 14, 41–835. [CrossRef] Eskom, T.D. Generation Connection Capacity Assessment of the 2022 Transmission Network. 2015. Available online: http://www.eskom.co.za/Whatweredoing/GCCAReport/Pages/GCCA2022UpdateInteractiveMap- .aspx (accessed on 18 October 2018). Krieger, N. After One Year of Operation, Tesla’s Australian Mega Battery Is Doing Just Fine. EngineeringCom, 2018. Availableonline: https://www.engineering.com/ElectronicsDesign/ElectronicsDesignArticles/ArticleID/ 17746/After-One-Year-of-Operation-Teslas-Australian-Mega-Battery-Is-Doing-Just-Fine.aspx (accessed on 20 October 2018). James, N. South Africa to Pilot First Utility-Scale Vanadium Redox Flow Battery. Engineering News. 2018. Available online: http://www.engineeringnews.co.za/article/lessons-from-the-deployment-of-first-utility- scale-redox-battery-2018-02-23 (accessed on 19 October 2018). 36. 37. 38. 39. 40. 41. 42. 43. 44. 45. 46. 47. 48. 49. 50. 51. 52. 53. 54. 55. © 2020 by the authors. Licensee MDPI, Basel, Switzerland. This article is an open access article distributed under the terms and conditions of the Creative Commons Attribution (CC BY) license (http://creativecommons.org/licenses/by/4.0/).