Download
1 / 18
0 likes | 12 Views
Explore UTI Small Cap Fund NAV and invest in top-performing small cap mutual funds. Track NAV, performance, and returns to maximize your investment potential.<br>https://www.utimf.com/mutual-funds/uti-small-cap-fund

E N D
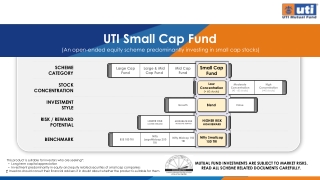
UTI Small Cap Fund (An open-ended equity scheme predominantly investing in small cap stocks) SCHEME CATEGORY Small Cap Fund Large Cap Fund Large & Mid Cap Fund Mid Cap Fund Low STOCK Moderate Concentration (40 - 60 stocks) High Concentration (> 60 stocks) Concentration (<40 stocks) CONCENTRATION INVESTMENT Blend Growth Value STYLE RISK / REWARD POTENTIAL HIGHER RISK HIGH REWARD LOWER RISK LOWER REWARD MODERATE RISK MODERATE REWARD Nifty Nifty Smallcap 150 TRI Nifty Midcap 150 TRI BENCHMARK BSE 100 TRI LargeMidcap 250 TRI This product is suitable for investors who are seeking*: • Long term capital appreciation • Investment predominantly in equity and equity related securities of small cap companies * Investors should consult their financial advisers if in doubt about whether the product is suitable for them MUTUAL FUND INVESTMENTS ARE SUBJECT TO MARKET RISKS, READ ALL SCHEME RELATED DOCUMENTS CAREFULLY. 1
TEAM Team driven approach Discussion & Review POWERED BY PROCESS Standardized research methodology Companies get Operating Cash Flow (OCF) & Return on Capital Employed (RoCE) ratings based on their previous 5 years financials 3 Tier Rating System RoCE Rating R2 R3 R1 OCF Rating C2 C3 C1 CONSISTENCY HIGH LOW CONSISTENCY HIGH LOW Identifying good stocks, avoiding poor stocks Consistency over time STRATEGIES Support diverse strategies Style discipline – mandate & style drive the choice of stocks across the OCF & RoCE tiers Operating Cash Flow (OCF) Tiers - 3 Tiers (C1/ C2/ C3) based on the number of years in which they have generated positive operating cash flows in the previous 5 years (for manufacturing companies). Return on Capital Employed (RoCE) / Implied Return on Equity (RoE) Tiers - 3 Tiers (R1/ R2/ R3) based on the previous 5-year average return on capital (for manufacturing companies & non-lending nonbanking finance companies (NBFCs)) & based on the previous 5-year average return on asset for banks & NBFCs (including housing finance companies). 2 MUTUAL FUND INVESTMENTS ARE SUBJECT TO MARKET RISKS, READ ALL SCHEME RELATED DOCUMENTS CAREFULLY
Diverse opportunities across sectors Indices Sector Weights Nifty Midcap 150 Nifty 50 Nifty Smallcap 250 Top 5 Overweight Sectors Top 5 Underweight Sectors 40 33 35 30 % Sectoral allocation 25 20 19 20 15 13 15 13 12 11 10 9 8 8 10 7 7 7 7 5 4 4 4 4 4 4 4 5 3 2 2 1 0 Capital Goods Healthcare Chemicals Consumer Durables Realty Financial Services Oil, Gas & Consumable Fuels IT FMCG Auto & Auto Compo Absent Small cap opportunities are more balanced than the large cap universe Source: IISL. Data as of September 30, 2024 3
Under-researched and under-owned Small caps have low analyst coverage and institutional ownership In-house framework for close monitoring of stocks INVESTMENT UNIVERSE 430 COMPANIES 40 AnalystCoverageperstock(Average) LargeCaps 35 30 25 MidCaps 20 Coverage based on Market cap* 15 Large Cap 98 10 SmallCaps Mid Cap 130 Small Cap 201 5 35% 40% 45% 50% 55% 60% InstitutionalOwnership Data asofSeptember 30,2024 *Based on AMFI data on market capitalization as on June 2024 Source: Bloomberg. Data as of June 30, 2024 UTI has established investment processes and experienced research team Market Cap Representation: Large Cap: Nifty 100, Mid Cap: Nifty Midcap 150, Small Cap: Nifty Smallcap 250 4
Investment Strategy 1 Focus on companies with scalable business models and long growth runway 2 Open to investing in good companies whose business/s are going through transitory phase of weakness OR undergoing a transformational change 3 Bottom-up approach for stock picking. Sector agnostic but prudential diversification 4 True to label: 65% to 80% of corpus invested in small cap companies & rest in mid cap stocks. 5 Flexibility to stay invested in mid caps that graduate to large cap status 5
Investment Approach: UTI Small Cap Fund BUSINESS SCALABILITY ― High and consistent growth companies with sustainable business models, long growth runway and run by seasoned managements carrying attributes of Profitable Volume Growth Cost Leverage Product Innovation High Return on Invested Capital BUSINESS SCALABILITY TURNAROUND STRATEGY TURNAROUND STRATEGY ― Invests in sound businesses going through weak operating business phase TRANSFORMATIONAL CHANGE ― Focus under valued opportunities with akin to potential mean reversion TRANSFORMATIONAL CHANGE ― Invests in businesses undergoing a transformational change and hence becoming potential re-rating candidates A portfolio that focuses on wealth creation with a balance of growth and value opportunities 6
Investment Framework Blend with Growth Tilt 01 Investment Style Blend of both Growth and Value with a tilt towards growth Bottom-up Approach 02 Stock Selection Invests in businesses which have or potential of generating High Return on Invested Capital (RoIC) Small cap dominated Preferred Allocation: Small Cap: 65-80%, Mid Cap: 20-35% 03 Market Cap Single Sector – Lower of 35% or Benchmark plus 12% Single Stock – Maximum of 5.50% Top 10 Stocks – Maximum of 30% 04 Internal Limits Moderate Churn 05 Portfolio Turnover Moderate churn portfolio in the medium to long term 7
UTI Small Cap Fund: Fund Facts Type of scheme Investment Objective The objective of the scheme is to generate long term capital appreciation by investing predominantly in equity and equity related securities of small cap companies. An open ended equity scheme predominantly investing in small cap stocks Fund Inception However, there can be no assurance or guarantee that the investment objective of the scheme would be achieved. 22nd December, 2020 Asset Allocation Fund Manager Indicative Allocation (% of total assets) Minimum Allocation (%) Mr. Ankit Agarwal, PGDM (IIM B) (Managing since December 2020) Total Work Experience: 18 Years Risk Profile Instruments Maximum Allocation (%) Equity and equity related instruments (minimum 65% of the total assets would be in equity and equity related instruments of small cap companies) Debt and Money Market instruments including securitized debt# Benchmark Medium to High 65 100 Nifty Smallcap 250 TRI Low to Medium 0 35 Minimum Investment ₹ 5,000/- and in multiples of ₹ 1/- Subsequent min. investment, ₹ 1,000/- and in multiples of ₹ 1/- Medium to High Units issued by REITs & InvITs 0 10 #The fund may invest up to 50% of its debt portfolio in securitized debt. 8
Fund Facts (contd.) Fund Snapshot Portfolio Composition# Fund Size: Monthly Avg. AuM : ₹ 4,649 Crores Last Day AuM OCF C1 C2 C3 ROCE R1 R2 R3 : : : 69% 18% 13% : : : 64% 26% 10% : ₹ 4,658 Crores Market Capitalisation (%) Price to Book Fund 0 13 87 BM 0 6 94 8.46 Large Mid Small : : : 9.39 Price to Earnings 42.75 48.74 Return on Equity Quantitative Indicators Fund 0.78 14.93% 18.22% 40.00% 1.10 BM 1.00 16.03 17.41 Beta SD (3 Years) PTR (Annual) : Sharpe Ratio : : Nifty Smallcap 250 TRI UTI Small Cap Fund - - : Top 5 / Top10 Stocks No. of Stocks 10.76% / 19.24% 90 Outside Benchmark Top 5 / Top 10 Sectors 43.49% 59.26% / 84.07% Avg. AuM – Average Asset under Management, BM – Benchmark, SD – Standard Deviation, PTR – Portfolio Turnover Ratio, Market cap – Market Capitalisation, ROCE – Return on Capital Employed.# Operating Cash Flow Tiers (C)- 3 Tiers based on the number of years in which they have generated positive operating cash flows in the previous 5 years (for manufacturing companies). RoCE/ Implied RoE Tiers (R) - 3 Tiers based on the previous 5 year average return on capital (for manufacturing companies & non-lending non banking finance companies (NBFCs)) & based on the previous 5 year average return on asset for banks & NBFCs (including housing finance companies). All data are as of September 30, 2024 9
Portfolio Top 20 Unique Stocks (As compared to Benchmark) Equity Top 20 Holdings STOCK NAME SECTOR % to NAV 1.79 1.68 1.61 1.57 1.39 1.35 1.33 1.28 1.28 1.28 1.21 1.14 1.02 1.01 0.99 0.97 STOCK NAME SECTOR % to NAV Act. Wt % CARBORANDUM UNIVERSAL LTD MARKSANS PHARMA LTD KPIT TECHNOLOGIES LTD COFORGE LTD SUBROS LTD TD POWER SYSTEMS LTD RAYMOND LIFESTYLE LTD ASHOKA BUILDCON LTD HERITAGE FOODS LTD INDIA SHELTER FINANCE CORP. AMI ORGANICS LTD DIXON TECHNOLOGIES (INDIA) LTD TEAMLEASE SERVICES LTD ORCHID PHARMA LTD JOHNSON CONTROLS - HITACHI AIR SHEELA FOAM LTD CAPITAL GOODS HEALTHCARE IT IT AUTO & AUTO COMPO. CAPITAL GOODS TEXTILES CONSTRUCTION FMCG FINANCIAL SERVICES HEALTHCARE CONSUMER DURABLES SERVICES HEALTHCARE CONSUMER DURABLES CONSUMER DURABLES MEDIA, ENTERT. & PUBLICATION CONSUMER SERVICES CHEMICALS IT MULTI COMMODITY EXCH OF IND. BRIGADE ENTERPRISES LTD TECHNO ELECTRIC & ENGG BLUE STAR LIMITED CARBORANDUM UNIVERSAL LTD WHIRLPOOL OF INDIA LTD COMPUTER AGE MANAG. SERV KARUR VYSYA BANK LTD MARKSANS PHARMA LTD KPIT TECHNOLOGIES LTD CAPLIN POINT LABORATORIES LTD COFORGE LTD PRAJ INDUSRIES LTD 360 ONE WAM LIMITED SONATA SOFTWARE LTD AVANTI FEEDS LTD KRISHNA INSTITUTE OF MEDI SCIE ERIS LIFESCIENCES LTD SUBROS LTD FIRSTSOURCE SOLUTIONS LTD FINANCIAL SERVICES REALTY CONSTRUCTION CONSUMER DURABLES CAPITAL GOODS CONSUMER DURABLES FINANCIAL SERVICES FINANCIAL SERVICES HEALTHCARE IT HEALTHCARE IT CAPITAL GOODS FINANCIAL SERVICES IT FMCG HEALTHCARE HEALTHCARE AUTO & AUTO COMPO. SERVICES 2.87 2.21 2.00 1.89 1.79 1.77 1.74 1.68 1.68 1.61 1.58 1.57 1.55 1.48 1.46 1.43 1.43 1.39 1.39 1.38 1.43 1.23 1.60 0.55 1.79 1.06 0.69 0.84 1.68 1.61 1.39 1.57 1.06 0.76 0.85 1.30 0.75 1.07 1.39 0.89 TIPS MUSIC LIMITED 0.97 V-MART RETAIL LTD ROSSARI BIOTECH LTD PERSISTENT SYSTEMS LTD OTHERS TOTAL 0.97 0.96 0.95 18.74 43.49 Portfolio above shows Top 20 equity holdings under the scheme, for detailed portfolio visit www.utimf.com Act. Wt % - Active Weight % (as compared to the Benchmark Index Nifty Smallcap 250 TRI) Data as of September 30, 2024 10
Portfolio Snippets Active Stock Position (As compared to Benchmark) Sectoral Breakdown (%) (As compared to Benchmark) Active Weight Financial Services 14.9 -5.5 Overweight (Top 5) Healthcare 12.7 1.0 % to NAV 1.79 Act. Wt % 1.79 Capital Goods 12.2 -0.7 STOCK NAME SECTOR Consumer Durables 11.8 4.9 CARBORANDUM UNIVERSAL CAPITAL GOODS IT 7.8 2.8 Services 6.0 2.8 MARKSANS PHARMA LTD HEALTHCARE 1.68 1.68 Construction 5.4 0.3 KPIT TECHNOLOGIES LTD IT 1.61 1.61 Chemicals 4.9 -2.4 TECHNO ELEC & ENG. CONSTRUCTION 2.00 1.60 Consumer Services 4.5 0.9 COFORGE LTD IT 1.57 1.57 Textiles 4.0 2.8 FMCG 3.9 -0.4 Auto & Auto Components 3.4 -1.0 % to NAV - Act. Wt % -1.34 STOCK NAME SECTOR Realty 2.2 -0.3 C.G. CONSUMER ELEC CENTRAL DEPOSITORY SERV. GLENMARK PHARMA LTD CONSUMER DURABLES Metals & Mining 1.2 -0.8 Media, Entert. & Publication 1.0 -0.7 FINANCIAL SERVICES - -1.28 Construction Materials 0.9 -0.4 HEALTHCARE - -1.26 Telecommunication 0.7 -1.1 Power -1.1 CHOLA FINANCIAL HOLDIN FINANCIAL SERVICES - -1.00 Oil, Gas & Consumable Fuels -2.5 LAURUS LABS LTD HEALTHCARE - -0.91 Diversified -0.4 Underweight (Top 5) 0 5 10 15 20 25 30 35 40 UTI Small Cap Fund Data as of September 30, 2024. Benchmark – Nifty Smallcap 250 TRI 11
Portfolio Commentary The valuation of mid and small caps despite of some moderations are still expensive trading above two standard deviations from long-term averages. FY25 could be the year where margin benefits may no longer help in earnings growth and EPS growth would largely be a function of topline growth. The consumption story as a structural play on the Indian economy. Therefore, the Fund continues to remain positive on long-term growth Discretionary and Consumer Services sectors. Fund is quite positive on the domestic in the Consumer Healthcare and Information Technology is another space that the Fund continues to favour on a long- term structural basis. The Fund primarily invests in companies that exhibit leadership quality in the segment they operate in. This could be in cost leadership, brand presence and product innovation, resulting in companies earning a high Return on Invested Capital (RoIC). The Fund focuses on buying good quality franchises and avoiding wealth destroyers that can take away longer-term returns. As a result, close to 60- 65% of the companies in the portfolio are in the R1 segment which have generating high Return (RoCEs). The Fund is positive on the long-term play in Capital Goods that benefit from domestic infrastructure growth. The Fund continues to remain positive on businesses in textile sector on account of expected improvement in exports across the business verticals. the on track Capital record Employed of The Fund also invests selectively in some tech names that drive innovation and names that benefit from investments in clean energy. 12
Performance Track Record UTI Small Cap Fund Performance Vs Benchmark as of 30/09/2024 Fund Performance Vs Benchmark Scheme Returns (%) 1 Year 41.09 3 Years 23.17 Since Inception 29.90 Growth of ₹ 10,000/- B: Nifty Midcap 150 TRI (₹) 15,149 20,136 33,212 Period B: Nifty Midcap 150 TRI (%) 51.49 26.25 37.43 AB: Nifty 50 TRI (%) 33.00 14.92 20.25 Scheme Returns (₹) 14,109 18,696 26,848 AB: Nifty 50 TRI (₹) 13,300 15,183 20,061 B - Benchmark, AB - Additional Benchmark, TRI - Total Return Index Different plans shall have a different expense structure. The performance details provided herein are of existing plan and growth option. CAGR – Compounded Annualized Growth Rate. The Scheme is currently managed by Mr. Ankit Agarwal since inception. Past performance may or may not be sustained in future. Inception of UTI Small Cap Fund : December 22, 2020. Period for which scheme’s performance has been provided is computed basis last day of the month-end preceding the date of advertisement. In case, the start/end date of the concerned period is a non-business day, the NAV of the previous date is considered for computation of returns. Performance of other open-ended schemes managed by the Fund Manager Mr. Ankit Agarwal Inception Date Fund Since UTI Mid Cap Fund 07-Apr-04 Aug-19 Nifty Midcap 150 TRI 1 Year (%) Fund 41.97 3 Years (%) Fund 20.25 5 Years (%) Fund 27.44 Managing the Scheme Benchmark (BM) BM 48.21 BM 26.12 BM 31.42 a. Mr. Ankit Agarwal manages 3 open-ended schemes of UTI Mutual Fund. b. Period for which scheme’s performance has been provided is computed basis last day of the month-end preceding the date of advertisement. c. Different plans shall have a different expense structure. The performance details provided herein are of Growth Option (Regular Plan). d. Data as on June 30, 2024 e. The returns of UTI Innovation Fund is not shown here as the fund is yet to complete 1 year of existence Performance of Permitted Category of FPI Portfolios managed by the Fund Manager Mr. Ankit Agarwal Portfolio Returns FPI 1 1 Year 32.16% Inception Date 03/03/2008 (i) (ii) (iii) (iv) Past performance may or may not be sustained in future. Mr Ankit Agarwal, advisor/ portfolio manager for above Permitted category FPI portfolio is also managing above domestic scheme. Returns are one year absolute returns The comparative of performance returns as detailed in the table above is pursuant to SEBI Circular no. Cir/IMD/DF/7/2012 dated February 28, 2012 pertaining to Regulation 24(b) of SEBI (Mutual Funds) Regulations, 1996 The performance is not comparable due to different investment objective/s and asset allocation. FPI is an Innovation Fund, different from the Domestic Schemes managed by the same Fund Manager (v) (vi) 13
Why invest in UTI Small Cap Fund? A true-to-label small-cap fund with a focus on scalable business models and long growth runway. Portfolio with zero large cap names, however, a mid cap growing to large cap may be part of the portfolio. Small-Caps have limited coverage on the sell side. UTI covers a large cross section of companies in the small-cap universe and adheres to well set risk management practices. The Fund maintains a well-diversified portfolio and follows a patient approach towards companies in the portfolio. Suitable for: Investors looking for investment in a portfolio that invests predominantly in small sized companies Suitable for investors with high risk taking ability and seeking to benefit from the potential high growth opportunity from a portfolio predominantly investing in small caps. 14
Product Label This product is suitable for investors who are seeking* Riskometer of Fund# Riskometer of Benchmark Name of the Scheme Nifty Midcap 150 TRI UTI Mid Cap Fund (An open ended equity scheme predominantly investing in mid cap stocks) • Long term capital appreciation • Investment predominantly in mid cap companies Nifty Small Cap 250 TRI UTI Small Cap Fund (An open ended equity scheme predominantly investing in small cap stocks) • Long term capital appreciation • Investment predominantly in equity and equity related securities of small cap companies Nifty 500 TRI UTI Innovation Fund (An open-ended equity scheme following innovation theme) • Long-term capital appreciation • Investment in equity and equity-related instruments following innovation theme *Investors should consult their financial advisers if in doubt about whether the product is suitable for them. #Risk-o-meter for the fund is based on the portfolio ending September 30, 2024. The Risk-o-meter of the fund/s is/are evaluated on monthly basis and any changes to Risk-o-meter are disclosed vide addendum on monthly basis, to view the latest addendum on Risk-o-meter, please visit addenda section on https://www.utimf.com/downloads 15
The information on this document is provided for information purposes only. It does not constitute any offer, recommendation or solicitation to any person to enter into any transaction or adopt any hedging, trading or investment strategy, nor does it constitute any prediction of likely future movements in rates or prices or any representation that any such future movements will not exceed those shown in any illustration. Users of this document should seek advice regarding the appropriateness of investing in any securities, financial instruments or investment strategies referred to on this document and should understand that statements regarding future prospects may not be realized. The recipient of this material is solely responsible for any action taken based on this material. Opinions, projections and estimates are subject to change without notice. UTI AMC Ltd is not an investment adviser, and is not purporting to provide you with investment, legal or tax advice. UTI AMC Ltd or UTI Mutual Fund (acting through UTI Trustee Company Pvt. Ltd) accepts no liability and will not be liable for any loss or damage arising directly or indirectly (including special, incidental or consequential loss or damage) from your use of this document, howsoever arising, and including any loss, damage or expense arising from, but not limited to, any defect, error, imperfection, fault, mistake or inaccuracy with this document, its contents or associated services, or due to any unavailability of the document or any part thereof or any contents or associated services. All complaints, regarding UTI Mutual Fund can be directed towards service@uti.co.in and for any unsatisfactory or lack of response visit www.scores.gov.in (SEBI SCORES portal) and /or visit https://smartodr.in/ (Online Dispute Resolution Portal). REGISTERED OFFICE: UTI Tower, ‘Gn’ Block, Bandra Kurla Complex, Bandra (E), Mumbai - 400051. Phone: 022 – 66786666. UTI Asset Management Company Ltd (Investment Manager for UTI Mutual Fund) Email: invest@uti.co.in . (CIN-L65991MH2002PLC137867). For more information, please contact the nearest UTI Financial Centre or your AMFI/NISM certified UTI Mutual Fund Distributor (MFD) for a copy of the Statement of Additional Information, Scheme Information Document and Key Information Memorandum cum Application Form. Mutual Fund Investments are subject to market risks, read all scheme related documents carefully. 16
Market Capitalisation: How is it classified? 1st-100thcompany in terms of full marketcapitalization LARGECAPS MID CAPS 101st -250thcompany in terms of full marketcapitalization SMALL CAPS 251st companyonwards in terms of full marketcapitalization MarketCapitalisation:Definitionof Large Cap, MidCap and SmallCap: As per the SEBIcircularSEBI/HO/IMD/DF3/CIR/P/2017/114of Oct 062017a definitionhasbeen providedof largecap, midcap and small cap asfollows.a) LargeCap: 1st-100thcompany intermsof fullmarket capitalizationb)MidCap: 101st-250thcompany in termsof fullmarket capitalizationc) SmallCap: 251stcompany onwardsintermsof fullmarket capitalization. 17
Thank You 18 Mutual Fund Investments are subject to market risks, read all scheme related documents carefully.