Download
1 / 17
170 likes | 185 Views
Our company have provide a intuit QB cashflow servay you can read our pdf file. We many list for your business you can visit us. We provide a many mathodlogy A custom online survey to 3,500 Small Business Owners at Companies of 0-100 Employees. Quota<br>set for a total of 1,000 respondents in US, 500 in each of 5 remaining markets: UK, India, Australia,<br>Canada, Brazil. And more information about Intuit QB Cashflow III Survey Quick Read Report April 2021 you can visit here. <br><br>https://www.wizxpert.com/

E N D
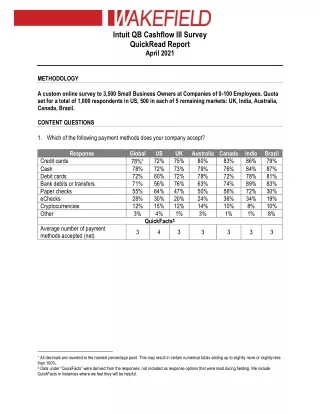
Intuit QB Cashflow III Survey QuickRead Report April 2021 METHODOLOGY A custom online survey to 3,500 Small Business Owners at Companies of 0-100 Employees. Quota set for a total of 1,000 respondents in US, 500 in each of 5 remaining markets: UK, India, Australia, Canada, Brazil. CONTENT QUESTIONS 1.Which of the following payment methods does your company accept? Response Global US Credit cards 78% 72% Cash 78% 72% Debit cards 72% 60% Bank debits or transfers 71% 56% Paper checks 55% 64% eChecks 28% 30% Cryptocurrencies 12% 15% Other 3% 4% QuickFacts± Average number of payment methods accepted (net) UK 75% 73% 72% 76% 47% 20% 12% 1% Australia Canada 80% 79% 78% 63% 50% 24% 14% 3% India 86% 84% 78% 89% 72% 34% 8% 1% Brazil 79% 87% 81% 83% 30% 19% 10% 8% 83% 76% 72% 74% 56% 36% 10% 1% 3 4 3 3 3 3 3 All decimals are rounded to the nearest percentage point. This may result in certain numerical totals adding up to slightly more or slightly less than 100%. ±Data under “QuickFacts” were derived from the responses, not included as response options that were read during fielding. We include QuickFacts in instances where we feel they will be helpful.
Wakefield Research Intuit QB Cashflow III Survey QuickRead Report April 2021 2.In which of the following ways does your company process payments from customers or clients? Response Global US Invoices 60% 57% Mobile payment apps 53% 46% Cash register or point-of-sale 47% 37% Contactless payments (digital wallets or NFC readers) Online checkout 42% 41% Mobile card reader 42% 36% Point-of-sale financing/payment installments Other 3% 4% QuickFacts Average number of ways used to process payments (net) 3.Which of the following, if any, did your company use for the first time since the COVID-19 pandemic? Response Global US Contactless payments (digital wallets or NFC readers) Mobile payment apps 16% 17% Online checkout 10% 12% Mobile card reader 10% 10% Invoices 9% 11% Point-of-sale financing/ payment installments Cash register or point-of-sale 6% 8% Other 1% 1% We used all of these pre-pandemic 53% 56% QuickFacts Average number of new ways used to process payments (net) Used something for the first time during the COVID-19 pandemic (net) UK 58% 51% 47% Australia Canada 59% 41% 59% India 71% 79% 62% Brazil 49% 62% 27% 68% 45% 57% 43% 31% 42% 39% 50% 74% 37% 54% 50% 40% 42% 40% 41% 54% 40% 26% 50% 35% 25% 36% 35% 38% 62% 24% 1% 1% 3% 0% 5% 4 4 4 4 4 4 4 UK Australia Canada India Brazil 20% 13% 21% 17% 24% 30% 21% 14% 13% 12% 6% 9% 6% 6% 9% 11% 9% 10% 9% 14% 12% 8% 4% 30% 10% 15% 15% 8% 6% 10% 12% 10% 6% 3% 5% 0% 53% 5% 0% 61% 8% 0% 54% 6% - 60% 4% 5% 33% 4 4 4 4 4 4 4 47% 44% 47% 39% 46% 40% 67% Page 2 of 17
Wakefield Research Intuit QB Cashflow III Survey QuickRead Report April 2021 4.What percentage of payment do you generally require in advance for your services or products? Response Global US 0% 18% 21% 1-25% 22% 21% 26-50% 36% 26% 51-75% 8% 8% 76-99% 5% 6% 100% 12% 19% QuickFacts Average (including 0) 40% 44% Average (excluding 0) 49% 56% 25% or more (net) 66% 63% 50% or more (net) 42% 50% 75% or more (net) 18% 27% 5.In general, how quickly do you require final payment after products or services have been provided? (Asked among those who do not require all payment in advance) Response Global US Immediately after completion 34% 40% 7 days after completion 19% 17% 10 days after completion 20% 11% 30 days after completion 22% 26% 60 days after completion 3% 3% 90 days after completion 2% 1% Other 1% 2% QuickFacts 7 days after completion or sooner (net) 30 days after completion or sooner (net) 6.Does your company use any payment incentives or penalties? Response Global US We add interest to late payments 33% 35% We incentivize early payments 32% 30% None of the above 47% 46% QuickFacts Any (net) 53% 54% UK 18% 21% 26% 13% 6% 15% Australia Canada 32% 20% 24% 11% 4% 10% India 2% 27% 59% 3% 6% 3% Brazil 11% 20% 57% 3% 2% 8% 20% 23% 33% 10% 6% 8% 42% 52% 65% 43% 22% 33% 48% 49% 33% 15% 38% 47% 64% 39% 16% 40% 41% 84% 26% 9% 39% 44% 74% 50% 10% UK 33% 17% 19% 26% 2% 3% - Australia Canada 35% 19% 22% 18% 4% 2% 0% India 9% 27% 40% 21% 2% 1% - Brazil 49% 11% 11% 20% 3% 2% 4% 33% 20% 21% 20% 4% 1% 1% 52% 57% 49% 54% 53% 37% 60% 94% 94% 94% 93% 94% 97% 91% UK 30% 30% 51% Australia Canada 24% 28% 58% India 33% 30% 50% Brazil 42% 47% 28% 31% 28% 50% 49% 42% 50% 50% 72% Page 3 of 17
Wakefield Research Intuit QB Cashflow III Survey QuickRead Report April 2021 7.What percentage of the payments that you receive from clients are paid on time? Response Global US 0-25% 8% 10% 26-50% 9% 8% 51-75% 18% 15% 76-99% 45% 38% 100% 20% 28% QuickFacts Average (percentage) 77% 78% 25% or more (net) 93% 91% 50% or more (net) 89% 86% 75% or more (net) 69% 74% 8.What methods have you used to collect outstanding payments? (Asked among those who are not always paid on time) Response Global US Offering flexible payment options 59% 52% Invoice factoring 29% 31% Hiring a collections agency 28% 28% Business mediation services 26% 20% Filing a lawsuit 23% 21% Other 2% 4% None of the above 13% 16% QuickFacts Any (net) 87% 84% 9.How often has the inability to move money in a timely manner disrupted your business operations or processes? Response Global US All the time 8% 13% Often 10% 8% Sometimes 26% 22% Just once or twice 26% 26% Never 28% 31% QuickFacts All the time / often (net) 19% 21% Sometimes or less often (net) 81% 79% Ever (net) 72% 69% UK 2% 6% 13% 59% 20% Australia Canada 6% 5% 11% 51% 28% India 3% 11% 43% 37% 5% Brazil 21% 18% 14% 34% 13% 3% 7% 15% 57% 18% 85% 99% 96% 82% 83% 95% 91% 84% 82% 97% 92% 78% 70% 97% 95% 45% 62% 79% 74% 49% UK 52% 33% 29% 28% 27% 1% 19% Australia Canada 56% 30% 30% 30% 29% 0% 11% India 78% 27% 21% 32% 19% - 6% Brazil 58% 19% 30% 21% 21% 3% 14% 60% 33% 30% 29% 23% 2% 10% 81% 89% 90% 94% 86% UK 7% 11% 22% 30% 30% Australia Canada 5% 11% 21% 27% 35% India 10% 8% 30% 29% 22% Brazil 5% 11% 40% 21% 23% 5% 15% 26% 25% 27% 17% 83% 70% 17% 83% 65% 21% 79% 73% 19% 81% 78% 16% 84% 77% Page 4 of 17
Wakefield Research Intuit QB Cashflow III Survey QuickRead Report April 2021 10.Which of the following, if any, has ever happened at your company due to the inability to move money in a timely manner? (Asked among those who have experienced disruptions due to the inability to move money) Response Global US Had to plan out purchases more strategically Incurred late payment fees 36% 29% Couldn’t pay vendors or subcontractors on time Had to forgo business opportunities 27% 23% Couldn’t pay employees on time 21% 12% Couldn’t pay rent on time 18% 12% Other 0% 1% None of these 12% 17% QuickFacts Any (net) 88% 83% 11.At any time in the history of your company, has cash flow been an issue? Response Global US Yes, more than once 28% 35% Yes, once 33% 22% No, never 40% 43% QuickFacts Yes (net) 60% 57% 12.When you have previously had cash flow issues, were those issues generally expected or a surprise? (Asked among those who have had cash flow issues) Response Global US Generally expected 56% 62% Generally a surprise 44% 38% 13.Has your business experienced cash flow issues in the last 12 months? (Asked among those who have had cash flow issues) Response Global US Yes 63% 61% No 37% 39% UK Australia Canada India Brazil 43% 46% 38% 38% 45% 44% 45% 33% 39% 36% 39% 43% 29% 21% 24% 32% 35% 50% 20% 25% 25% 20% - 15% 29% 27% 27% 0% 8% 29% 25% 23% 0% 10% 26% 32% 21% - 9% 35% 12% 11% - 10% 85% 92% 90% 91% 90% UK 20% 36% 43% Australia Canada 17% 36% 47% India 23% 46% 31% Brazil 41% 31% 29% 21% 36% 42% 57% 53% 58% 69% 71% UK 58% 42% Australia Canada 63% 37% India 42% 58% Brazil 56% 44% 55% 45% UK 66% 34% Australia Canada 67% 33% India 53% 47% Brazil 78% 22% 57% 43% Page 5 of 17
Wakefield Research Intuit QB Cashflow III Survey QuickRead Report April 2021 14.What are currently the biggest causes of cash flow issues in your business? (Asked among those who have had cash flow issues) Response Global US Decreasing sales or profit margins 31% 27% Not getting paid by customers or clients according to agreed payment terms Lack of cash reserves 26% 25% Seasonal changes in customer demand Outstanding receivables 23% 20% Debt payments 20% 16% The time it takes the money to process after receiving a payment High cost of capital investments 16% 12% High rent payments 16% 13% Over-investment in inventory 15% 11% Inaccurate cash flow forecasting 14% 10% Growing the business too quickly 13% 12% Other 3% 6% 15.Have cash flow issues ever negatively affected any of the following aspects of your business? (Asked among those who have had cash flow issues) Response Global US Business growth 40% 42% Ability to take on new projects 31% 28% Capital investment 25% 21% Payroll 23% 21% Employee pay raises 23% 19% Ability to pay taxes 22% 16% Employee benefits 21% 16% Recruitment 19% 13% Employee retention 17% 13% Other 0% 0% None of these 11% 15% QuickFacts Any (net) 89% 85% UK 27% Australia Canada 25% India 25% Brazil 53% 25% 27% 29% 23% 28% 24% 28% 29% 29% 20% 27% 23% 29% 25% 19% 23% 35% 28% 26% 24% 19% 16% 21% 20% 22% 20% 21% 34% 35% 19% 17% 16% 20% 25% 17% 17% 9% 16% 21% 12% 21% 22% 4% 16% 19% 20% 21% 17% 0% 19% 18% 19% 17% 16% 4% 28% 19% 22% 15% 13% 1% 10% 9% 8% 10% 6% 2% UK 39% 23% 24% 24% 23% 23% 22% 22% 20% - 14% Australia Canada 39% 26% 25% 28% 22% 27% 25% 20% 23% 0% 9% India 34% 35% 29% 28% 30% 22% 29% 26% 28% 0% 13% Brazil 42% 45% 27% 17% 20% 19% 19% 16% 7% 0% 6% 41% 28% 30% 28% 30% 32% 22% 19% 18% 0% 8% 86% 91% 92% 87% 94% Page 6 of 17
Wakefield Research Intuit QB Cashflow III Survey QuickRead Report April 2021 16.How stressed do you feel, if at all, because of your company’s cash flow issues? (Asked among those who have had cash flow issues) Response Global US Very stressed 31% 30% Somewhat stressed 51% 45% Not very stressed 15% 20% Not at all stressed 3% 5% QuickFacts Very / somewhat stressed (net) 82% 75% Not very / not at all stressed (net) 18% 25% 17.Which of the following, if any, have contributed to your stress as a business owner? Response Global US Economic conditions 37% 38% Work/life balance 34% 37% Growing my business 32% 31% Competition 26% 20% The daily grind of running my business Managing expenses (payroll, vendor payments, etc.) Cash flow issues 23% 20% Meeting consumer demand 23% 18% Employee retention 17% 13% Other 2% 3% None of these 5% 6% QuickFacts Any (net) 95% 94% UK 30% 55% 12% 3% Australia Canada 30% 53% 17% 1% India 38% 49% 12% 1% Brazil 36% 47% 14% 3% 21% 63% 13% 2% 84% 16% 82% 18% 84% 16% 88% 12% 83% 17% UK 36% 36% 32% 24% Australia Canada 37% 32% 30% 28% India 31% 34% 39% 43% Brazil 43% 28% 32% 20% 33% 34% 30% 24% 24% 29% 24% 25% 26% 18% 19% 23% 20% 19% 24% 22% 26% 30% 18% 24% 17% 2% 7% 23% 26% 22% 0% 4% 21% 25% 19% 2% 7% 27% 30% 22% - 1% 30% 18% 11% 2% 5% 93% 96% 93% 99% 95% Page 7 of 17
Wakefield Research Intuit QB Cashflow III Survey QuickRead Report April 2021 18.How much is cash flow a cause of stress for you as a business owner? (Asked among those who feel stressed because of cash flow issues) Response Global US This is the top cause of stress 26% 30% This is a top 3 cause of stress 50% 42% This is a top 10 cause of stress 20% 22% This is not a top 10 cause of stress 4% 6% QuickFacts At least a top 3 cause of stress (net) 76% 72% At least a top 10 cause of stress (net) 19.How much active management do your cash outflows require? That is, strategically timing certain payments or expenditures to ensure you have sufficient cash on hand. Response Global US A great deal of active management 30% 30% Some active management 44% 37% Only a little active management 19% 24% No active management at all 7% 9% QuickFacts A great deal / some active management (net) A little / no active management (net) 26% 33% Requires active management (net) 93% 91% 20.How many times, if any, have you made a poor business decision specifically because you were concerned about insufficient cash flow? Response Global US More than once 25% 30% Once 34% 27% Never 41% 44% QuickFacts Ever (net) 59% 56% UK 22% 59% 17% 2% Australia Canada 19% 60% 20% 2% India 27% 41% 31% 1% Brazil 36% 48% 10% 7% 13% 64% 22% 1% 81% 78% 77% 68% 84% 96% 94% 98% 98% 99% 99% 93% UK 28% 47% 18% 7% Australia Canada 19% 41% 30% 10% India 47% 50% 2% 0% Brazil 36% 45% 14% 5% 23% 49% 20% 8% 74% 67% 75% 60% 73% 98% 81% 25% 93% 40% 90% 27% 92% 2% 100% 19% 95% UK 20% 35% 45% Australia Canada 17% 35% 47% India 20% 38% 42% Brazil 42% 34% 24% 18% 40% 42% 55% 53% 58% 58% 76% Page 8 of 17
Wakefield Research Intuit QB Cashflow III Survey QuickRead Report April 2021 21.Where did your startup funds come from? Response Global US Personal savings 63% 67% Business loans 35% 25% Family and/or friends 26% 24% Personal loans 24% 19% Investor or venture capital 19% 13% Crowdfunding 11% 7% Other 2% 2% None of the above 2% 4% QuickFacts Any (net) 98% 96% 22.Have you ever contributed personal money to keep your business running? Response Global US Yes, more than once a quarter 16% 22% Yes, once a quarter 13% 12% Yes, twice a year 19% 12% Yes, once a year 16% 11% Yes, less than once a year 28% 35% Never 9% 7% QuickFacts At least once a quarter (net) 29% 34% At least once a year (net) 63% 57% Ever (net) 91% 93% 23.How many times, if any, have you struggled to pay your company’s suppliers specifically due to cash flow issues? (Asked among those who have had cash flow issues) Response Global US More than once 34% 44% Once 46% 28% Never 21% 28% QuickFacts Ever (net) 79% 72% UK 57% 35% 23% 23% 24% 9% 0% 3% Australia Canada 57% 39% 23% 26% 18% 10% 0% 1% India 66% 60% 38% 35% 36% 23% 0% 0% Brazil 70% 19% 27% 23% 8% 4% 8% 2% 55% 42% 22% 26% 21% 16% 0% 4% 97% 99% 96% 100% 98% UK 10% 13% 16% 15% 33% 13% Australia Canada 8% 12% 19% 17% 31% 14% India 12% 18% 32% 26% 6% 7% Brazil 26% 11% 17% 16% 25% 4% 9% 14% 22% 15% 27% 13% 23% 54% 87% 20% 55% 86% 23% 60% 87% 30% 87% 93% 38% 71% 96% UK 21% 54% 24% Australia Canada 17% 58% 25% India 30% 65% 5% Brazil 51% 36% 13% 25% 49% 27% 76% 75% 73% 95% 87% Page 9 of 17
Wakefield Research Intuit QB Cashflow III Survey QuickRead Report April 2021 24.To what extent, if at all, has this negatively impacted your relationship with the supplier? (Asked among those who have had cash flow issues) Response Global US It had a major negative impact 17% 23% It had a somewhat negative impact 48% 36% My relationship was not negatively impacted QuickFacts Relationship was negatively impacted (net) 25.How many times, if any, has your business been charged a fee for late payment specifically due to cash flow issues? (Asked among those who have had cash flow issues) Response Global US More than once 29% 39% Once 43% 32% Never 28% 30% QuickFacts Ever (net) 72% 70% 26.Have you ever thought you had more money than you did because you forgot about a business expense you’d paid and the money was still in your bank account? Response Global US Yes, once a month 7% 10% Yes, once every two months 5% 6% Yes, once a quarter 11% 8% Yes, twice a year 9% 6% Yes, once a year 12% 6% Yes, less than once a year 15% 15% No, never 40% 49% QuickFacts At least once a quarter (net) 23% 24% At least once a year (net) 45% 37% Ever (net) 60% 51% UK 14% 44% Australia Canada 17% 56% India 20% 46% Brazil 10% 62% 15% 51% 35% 41% 42% 26% 35% 35% 29% 65% 59% 58% 74% 65% 65% 71% UK 23% 51% 26% Australia Canada 20% 55% 25% India 22% 57% 21% Brazil 35% 29% 36% 24% 47% 29% 74% 75% 71% 79% 64% UK 2% 8% 16% 10% 8% 18% 39% Australia Canada 4% 4% 15% 5% 11% 17% 45% India 7% 3% 11% 16% 32% 4% 26% Brazil 11% 3% 9% 12% 9% 20% 38% 3% 7% 13% 10% 14% 16% 37% 26% 44% 61% 22% 38% 55% 23% 47% 63% 22% 70% 74% 22% 42% 62% Page 10 of 17
Wakefield Research Intuit QB Cashflow III Survey QuickRead Report April 2021 27.In your experiences at your company, which business costs have you found to be the hardest to plan for? Response Global US Equipment & supplies costs 36% 37% Material costs 35% 28% Labor costs 31% 22% Administrative costs 30% 18% Shipping costs 21% 20% Research & development costs 20% 15% Credit card fees 19% 14% None of these 13% 19% QuickFacts Any (net) 87% 81% 28.Do you know how much money is coming into your business on a monthly basis? Response Global US Yes, exactly 37% 36% Yes, generally 54% 54% No 9% 10% QuickFacts Yes (net) 91% 90% 29.Do you know how much money your company spends on business expenses on a monthly basis? Response Global US Yes, exactly 41% 39% Yes, generally 53% 57% No 6% 5% QuickFacts Yes (net) 94% 95% UK 26% 26% 27% 34% 23% 19% 19% 19% Australia Canada 34% 36% 31% 35% 24% 24% 23% 14% India 41% 51% 49% 34% 19% 28% 18% 3% Brazil 38% 42% 37% 38% 17% 17% 27% 5% 37% 33% 32% 34% 25% 21% 19% 12% 81% 86% 88% 97% 95% UK 32% 56% 11% Australia Canada 38% 46% 16% India 43% 53% 4% Brazil 47% 49% 4% 26% 65% 9% 89% 84% 91% 96% 96% UK 36% 56% 8% Australia Canada 45% 47% 8% India 51% 46% 2% Brazil 49% 45% 6% 32% 61% 7% 92% 92% 93% 98% 94% Page 11 of 17
Wakefield Research Intuit QB Cashflow III Survey QuickRead Report April 2021 30.How confident are you, if at all, that you know how much money your company currently has in outstanding receivables? Response Global US Completely confident 33% 36% Very confident 40% 39% Somewhat confident 19% 22% Somewhat not confident 5% 2% Not very confident 2% 1% Not at all confident 1% 1% QuickFacts Completely / very confident (net) 73% 74% Confident (net) 92% 96% Not confident (net) 8% 4% 31.Approximately how much money, if any, does your company currently have in outstanding receivables? (Asked among those confident they know how much their company has in outstanding receivables) Response $100 or less $101 - $5,000 $5,001 - $20,000 More than $20,000 QuickFacts Average (dollars) Response £100 or less £101 - $5,000 £5,001 - $20,000 More than £20,000 QuickFacts Average (pounds) Response A$100 or less A$101 - A$5,000 A$5,001 - A$20,000 More than A$20,000 QuickFacts Average (Australian dollars) UK 25% 46% 17% 8% 2% 1% Australia Canada 30% 39% 17% 9% 3% 1% India 49% 40% 5% 1% 6% - Brazil 26% 39% 27% 6% 1% 1% 26% 38% 24% 9% 2% 1% 71% 89% 11% 70% 86% 14% 64% 88% 12% 89% 94% 6% 64% 92% 8% US 27% 24% 14% 35% 90,382 UK 21% 15% 30% 35% 43,407 Australia 29% 19% 23% 29% 57,525 Page 12 of 17
Wakefield Research Intuit QB Cashflow III Survey QuickRead Report April 2021 Response C$100 or less C$101 - C$5,000 C$5,001 - C$20,000 More than C$20,000 QuickFacts Average (Canadian dollars) Response ₹100 or less ₹101 - ₹5,000 ₹5,001 - ₹20,000 More than ₹20,000 QuickFacts Average (Rupees) Response 100 BRL or less 101 BRL-5,000 BRL 5,001 BRL-20,000 BRL More than 20,000 BRL QuickFacts Average (Brazilian real) 32.Does your business currently have a business bank account? Response Global US Yes, more than one 35% 33% Yes, one 54% 57% No 12% 11% QuickFacts Yes (net) 88% 89% 33.Approximately how many tools, if any, do you use to manage your business cash flow? Response Global US I don’t use any cash flow management tools 1 to 3 64% 57% 4 to 6 7% 6% More than 6 1% 3% QuickFacts Uses tools to manage cash flow (net) Canada 20% 13% 25% 42% 64,300 India 6% 1% 3% 91% 394,388 Brazil 14% 22% 15% 49% 120,240 UK 35% 55% 10% Australia Canada 30% 57% 14% India 55% 44% 1% Brazil 24% 52% 24% 33% 55% 12% 90% 86% 88% 99% 76% UK Australia Canada India Brazil 27% 34% 32% 22% 24% 12% 30% 60% 7% 1% 65% 11% 1% 69% 7% 0% 76% 10% 2% 66% 4% 0% 73% 66% 68% 78% 76% 88% 70% Page 13 of 17
Wakefield Research Intuit QB Cashflow III Survey QuickRead Report April 2021 34.Which one of the following tools, if any, does your business use most often to manage cash flow? (Asked among those who use tools to manage cash flow) Response Global US QuickBooks 24% 44% Microsoft Office 18% 13% Tools that my bank offers 8% 6% Google Docs 8% 9% Xero 6% 2% SAP Concur 6% 2% Square 5% 8% FreshBooks 4% 2% CashAnalytics 3% 3% Float 3% 1% Cushion 2% 1% Expensify 2% 1% Wave 2% 1% PlanGuru 2% 1% Thrive 2% 1% BlueVine 1% 1% Brex 1% 0% Other 3% 3% 35.How much does [RESPONSE FROM Q34] help with managing your business’s cash flow? (Asked among those who use tools to manage cash flow) Response Global US Helps completely 43% 39% Helps a great deal 38% 41% Helps somewhat 16% 16% Helps a little 3% 4% Does not help at all 0% 0% QuickFacts Helps completely / a great deal (net) 81% 80% Helps (net) 100% 100% 100% UK 26% 19% 5% 7% 12% 4% 3% 5% 1% 2% 3% 1% 2% 2% 2% 1% 2% 3% Australia Canada 11% 18% 6% 7% 12% 5% 3% 4% 6% 4% 4% 4% 3% 3% 4% 3% 2% 2% India 14% 14% 8% 7% 4% 15% 9% 7% 1% 5% 4% 4% 1% 3% 1% 1% 1% 1% Brazil 4% 42% 24% 12% 1% 3% 0% - 4% 1% 1% 1% 2% 0% 1% 0% 0% 4% 30% 9% 4% 5% 8% 5% 7% 7% 4% 4% 2% 3% 3% 2% 1% 1% 1% 5% UK 39% 41% 16% 4% 0% Australia Canada 35% 41% 19% 5% 0% India 71% 24% 4% 0% 0% Brazil 31% 49% 19% 1% 0% 38% 37% 22% 3% 0% 80% 76% 100% 75% 100% 95% 100% 80% 100% Page 14 of 17
Wakefield Research Intuit QB Cashflow III Survey QuickRead Report April 2021 36.What are the top reasons why [RESPONSE FROM Q34] is not completely helpful with managing your business’s cash flow? (Asked among those whose cash flow management tool is not completely helpful) Response Global US It doesn’t track everything I’d like it to It doesn’t automate all the functions I’d like it to It lacks integration with other tools I use to manage my business It does not offer forecasting 22% 19% It does not offer effective tax management features It does not provide comprehensive visibility It is confusing to use/not user-friendly It doesn’t offer an effective mobile experience Other 4% 5% 37.Which of the following do you most prefer for your tools that manage cash flow? (Asked among those who use tools to manage cash flow) Response Global US Mobile optimization only 11% 14% Desktop optimization only 26% 30% A combination of mobile and desktop optimization UK Australia Canada India Brazil 30% 32% 31% 27% 32% 30% 28% 29% 23% 34% 29% 30% 30% 35% 27% 25% 25% 22% 22% 22% 43% 26% 27% 22% 28% 13% 21% 19% 22% 26% 21% 26% 14% 16% 11% 18% 22% 15% 23% 13% 16% 14% 17% 22% 21% 14% 7% 15% 13% 15% 19% 21% 15% 10% 6% 4% 2% 0% 1% UK 5% 23% Australia Canada 6% 19% India 17% 22% Brazil 10% 24% 9% 35% 63% 56% 72% 74% 56% 61% 65% Page 15 of 17
Wakefield Research Intuit QB Cashflow III Survey QuickRead Report April 2021 38.If your company uses tools to forecast your business cash flow, approximately how far ahead do you look? Response Global US Less than a month 6% 10% One to three months 21% 24% Four to six months 26% 19% Seven to twelve months 18% 9% More than a year 5% 6% My company doesn’t use tools to forecast business cash flow QuickFacts 6 months or less in advance (net) 53% 53% 7 months or further in advance (net) 23% 15% Uses tools to forecast (net) 76% 67% 39.How much time do you spend each week managing the money in your business? Response Global US 1 hour 12% 17% 2 hours 15% 21% 3 to 5 hours 33% 33% 6 to 9 hours 26% 15% 10 to 15 hours 9% 9% 16 to 19 hours 2% 3% 20+ hours 3% 3% QuickFacts 1-2 hours (net) 27% 38% 10+ hours (net) 14% 14% 40.If you had to guess, do you expect your company’s revenue to increase, decrease or stay the same in the next 12 months? Response Global US Increase significantly 19% 20% Increase somewhat 45% 45% Stay the same 28% 27% Decrease somewhat 7% 6% Decrease significantly 1% 2% QuickFacts Increase (net) 64% 66% Decrease (net) 8% 7% UK 3% 18% 31% 19% 4% Australia Canada 1% 17% 38% 18% 5% India 5% 9% 34% 39% 6% Brazil 11% 32% 16% 6% 6% 3% 22% 26% 23% 2% 24% 33% 26% 19% 23% 7% 28% 51% 23% 74% 57% 24% 81% 51% 25% 77% 48% 46% 93% 60% 12% 72% UK 10% 14% 25% 33% 12% 4% 2% Australia Canada 11% 13% 37% 30% 6% 1% 2% India 1% 5% 39% 44% 5% 3% 5% Brazil 17% 18% 31% 16% 9% 3% 5% 14% 14% 32% 27% 12% 1% 1% 25% 17% 24% 9% 28% 14% 5% 13% 35% 17% UK 15% 48% 30% 6% 1% Australia Canada 12% 38% 37% 11% 1% India 37% 53% 9% 1% 0% Brazil 17% 41% 29% 11% 2% 10% 46% 36% 6% 1% 63% 7% 50% 12% 57% 7% 90% 1% 57% 13% Page 16 of 17
Wakefield Research Intuit QB Cashflow III Survey QuickRead Report April 2021 Methodological Notes: The Intuit QB Cashflow III Survey was conducted by Wakefield Research (www.wakefieldresearch.com) among 3,500 Small Business Owners at Companies of 0-100 Employees. Quota set for a total of 1,000 respondents in US, 500 in each of 5 remaining markets: UK, Australia, Canada, India Brazil.When reporting tracking data, the data was weighted to ensure samples could be compared to data collected in 2019. Results of any sample are subject to sampling variation. The magnitude of the variation is measurable and is affected by the number of interviews and the level of the percentages expressing the results. For the interviews conducted in this particular study, the chances are 95 in 100 that a survey result does not vary, plus or minus, by more than 3.1 percentage points in the US and 4.4 percentage points in the UK, Australia, Canada, India and Brazil compared to the true population value for each of these countries. Page 17 of 17