Download
1 / 4
40 likes | 1.32k Views
GCSE Maths Statistics & Probability. S 14 Histograms with Unequal Class Intervals. Subject Content Reference: S3.2h . 3. Frequency Density. 2. 1. 50. 100. 150. 200. 250. Time in minutes. A histogram with unequal class intervals uses the notion of frequency density . .

E N D
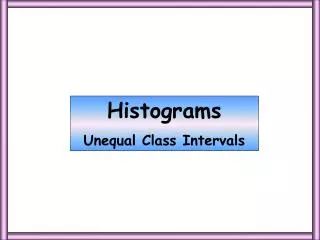
GCSE MathsStatistics & Probability S 14 Histograms with Unequal Class Intervals Subject Content Reference: S3.2h
3 Frequency Density 2 1 50 100 150 200 250 Time in minutes A histogram with unequal class intervals uses the notion of frequency density . . Frequency Density = Frequency ÷ Class Interval Example The following table shows the time (in minutes) taken for 100 athletes to complete a marathon. Draw up a histogram and from it, estimate the number of athletes who took between 21/2 and 3 hours to finish: Step 1: Draw the axes for time and frequency density . . Step 2: Draw in the bars . . Step 3: Shade in the parts of the histogram between 21/2 and 3 hours (150 and 180 mins) . . . . and calculate the frequency represented = 1/2(16) + 28 + 2/5(35) = 8 + 28 + 14 = 50 answer It’s important to realise that the area of each rectangle represents the frequency (frequency density x time)
Exercise 1 1) The following table shows the time taken for members of a cycling club to finish a 100 km charity ride: a) Complete the table by calculating frequency densities: b) Draw a histogram to show this information: c) Use the histogram to estimate the number of cyclists completing the ride between 21/2 and 31/2 hours:
Exercise 1 (cont’d) 2) The following table shows the distance covered by cars in a 24 hour race: a) Complete the table by calculating frequency densities: b) Draw a histogram to show this information: c) Use the histogram to estimate the number of cars covering between 2650 and 3150 km: