Download
1 / 46
460 likes | 821 Views
Poor Areas or Poor People? Learning from Latin America. Ana Revenga World Bank September 9, 2009. Presentation Outline. Introduction Poverty differences across space Why Worry? Economic & social concerns about regional inequalities What to do? Policy Dilemmas World Bank’s study in LAC

E N D
Poor Areas or Poor People? Learning from Latin America Ana Revenga World Bank September 9, 2009
Presentation Outline • Introduction • Poverty differences across space • Why Worry? Economic & social concerns about regional inequalities • What to do? Policy Dilemmas • World Bank’s study in LAC • Why a study on LAC? • Questions addressed • Methodology • Results for LAC (& Thailand) • Policy Implications
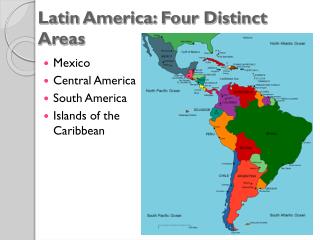
Introduction • In most countries, economic development is uneven across space. • People in urban areas tend to be better off that people in rural areas.
Introduction • In many countries entire regions tend to better or worse off than other regions. • Brazil NE vs. SE region • Mexico North vs. South Pacific
Differences in Poverty Rates: Using region-specific poverty lines (WB estimates) Brazil Within Regions Across Regions
Differences in Poverty Rates: Using poverty lines for U & R areas Mexico Within Regions Across Regions 7
Introduction • Reductions in poverty rates over time tend to be uneven across regions • Thailand:Experienced a substantial reduction in poverty rate over the last 20 years. • Relative to the levels in 1988, the proportional reduction in poverty has been largest in Bangkok, followed by the Central, South, and North regions; the reduction was slowest in the Northeast. • Because poverty is falling more rapidly in other regions, it has become more concentrated in the Northeast.
Thailand: Poverty Headcount and Density by Province, 1988, 1994, and 2002
Economic and social concerns about regional inequalities: • High inequality may compromise economic efficiencyand growth (e.g. absent credit market may prevent poorer households from investing more). • Inequality in political influence may lead to a distorted allocation of public services. • Greater income inequality may be associated with lower social cohesion and higher incidence of crime that increase the cost of doing business.
Policy Dilemmas • Equity vs. Efficiency: • important trade-offs may be associated with the promotion of regional and spatial equity and overall economic efficiency. (WDR, 2009) : “economic growth is seldom balanced, and efforts to spread it prematurely will jeopardize progress.” ) • Long-term vs. Short term: • Should policies focus more on facilitating the drivers of long-run growth and less on spatial inequality at any given point in time? • Equality of what? • Equality of welfare (consumption or income) or equality of opportunities? • Policies aimed at equalizing outcomes many be misplaced (outcomes depend on individual efforts as well as endowments/assets) • Better to focus at equalizing opportunities for welfare. 11
Explaining Spatial Poverty:Two Extreme Views Concentration • Poor individuals with low human capital (and other assets) are spatially concentrated • Policy Implication: • Invest in human capital development e.g. CCTs such as BolsaFamilia Geography • Returns to capital and labor remain different across space. • Policy Implication: • Invest in territorial development programs / infrastructure
Reality lies somewhere between the two extreme views: • shaped by the extent to which: • There are impediments to migration • Theory: migrate if Benefits(destination)-Benefits(origin) > Costs • Key push and pull factors: monetary and psychic costs of migration, uncertainty about the benefits of migration, education level, access to basic services, etc. • There are agglomeration effects in Urban areas returns increase as human capital concentrates in one geographic area
Lack of consensus • Lack of consensus on how to deal with the problem of differences in the standard of living between regions. • Many of these programs are targeted towards “poor regions”, while • other programs are targeted towards “poor people”
Brazil: Policies about regional inequalities have evolved over time 1960-90, public policies targeted to the poorer NE region: • tax incentives • public credits to subsidize private initiatives • directly investing in infrastructure and related territorial development programs in the NE. • This hastened industrialization but failed to reduce poverty or equalize income. • Since 2000 shift of emphasis towards a program targeted to poor people instead of poor areas. • The Bolsa Familia conditional cash transfer program
Recent WB study on Determinants of Regional Welfare Disparities in LAC • Tries to shed light on some of the issues mentioned above • Informs policies to reduce inequality in standards of living. • Summarizes the main factors affecting current welfare (consumption) • Returns to Characteristics (Geography) • Characteristics (Concentration)
Why is the LAC experience useful? • Regional disparities seem to be quite persistent over time and play a major role in explaining total inequality. • A variety of policies and programs have been employed in the efforts to reduce regional disparities • Extensive literature on regional disparities (e.g. Brazil) • Diversity of cultures and geography within countries • LAC region has very good data
Questions addressed: • Are the differences in returns to characteristics or the difference in the characteristics themselves the main determinant of the welfare differential within and across regions? • What is the role of migration in equalizing the returns to characteristics across regions? • What are the main lessons learned from some major regional development programs in LAC?
Countries Included: • Bolivia • Brazil • Colombia • Ecuador • Peru • Nicaragua • Guatemala • Mexico
Methodology • Use the Oaxaca-Blinder decomposition method, to examine whether the primary explanation for the differences in living standards within regions (urban vs. rural areas) and across regions in a country is due to • differences in the (productive) characteristics of households (concentration effect) or • differences in the returns to those characteristics between poorer and richer areas
Decomposition Results within RegionsUrban vs. Rural areas • Results depend upon the country and region • But, in general, welfare differences between urban and rural regions seem to be primarily due to the concentration of people with higher characteristics (such as education level) in the urban areas of these regions. • Thus, migration of labor from rural to urban areas equalizes returns to education within regions (within short distances)
Decomposition Results Across RegionsLeading vs. Lagging Regions • Differences in returns play a much larger role in explaining welfare differentials than they did between urban and rural areas of the same region • That is, people living in cities of the leading region have roughly comparable characteristics to those of urban dwellers of the lagging region, but the latter receive much lower rewards for these characteristics than the former • Distance matters (especially for the unskilled). Spatial proximity appears to be a key driving factor. There are constraints to the equalizing role of migration in terms of “moving people to jobs.”
Distance matters: Honduras Internal Migration Recent migration
Applying the methodology to Thailand • Using 2007 panel Socioeconomic Survey SES (about 6,000 households) we investigated fraction of the differential in the ln of PCE (deflated by National and Rural CPI) explained by differences in household characteristics (endowments) and by differences in returns to characteristics (coefficients) • Caveats: • Is the survey representative for urban and rural areas at the national level? • Is the survey representative at the regional level? • Representative for urban and rural areas within regions?
Preliminary Results for Thailand Appear to be in line with the results for LAC countries. Urban vs. Rural Areas • Welfare differences between urban and rural areas seem to be primarily due to the concentration of people with higher characteristics (such as education level) in the urban areas of these regions. Bangkok vs. all other Urban areas & NE vs. Rural • Differences in returns play a much larger role in explaining welfare differentials • People living in Bangkok (leading region) have roughly comparable characteristics to those of dwellers in other urban but receive much higher rewards for these characteristics (consistent with the presence of agglomeration effects) 29
What does this all mean for policy?-1 • Governments can implement two broad types of interventions to promote equality of opportunities for welfare: • interventions aimed towards improving the education and human capital characteristics of the individuals; • interventions directed towards improving the returns to characteristics in lagging regions.
Implications for Policy-2 • Invest in people: Governments should continue investing in programs that equalize opportunities for welfare. i.e. increase the portable human capital endowments of poor people, who can then make their own choice of whether or not to migrate in search of better opportunities. • Examples: • CCTs or Increasing access and utilization of more schooling and health services • increase the quality of the educational and health services provided. • Impact evaluations confirm the positive impacts of these interventions on human capital and short-term poverty.
Implications for Policy-2 • NOTE: Another way governments can Invest in People is by increasing access to basic public services such as electricity, water and sanitation. • Increased access to basic public services leads to better and higher endowments (education and health) which allow people to take advantage of economic opportunities through migration • The Human Opportunity Index (HOI) provides a new way of measuring and monitoring inequality of access to basic services and the socioeconomic groups and regions that have been most excluded • The HOI index applied in Brazil suggests that there are serious disparities in opportunities among different states and facilitates the prioritization of where to intervene first.
The Human Opportunity Index can vary inside a country No state in Brazil has an Opportunity Index similar to Chile. Several states have an index inferior to Guatemala Opportunity Index of completing 6th grade on time Uruguay
Implications for Policy-3 • Remove barriers: Try to eliminate impediments to labor mobility and facilitate the movement of people towards areas of economic opportunity. • This implies investments in spatially connective infrastructure (such as roads that facilitate the movement of goods, services and people across regions) as well as institutions ensuring that all markets—land, labor, credit, insurance, goods and services—operate efficiently everywhere.
Implications for Policy-4 • What about local-level programs and territorial development initiatives? • Appropriate in specific circumstances but need more systematic evaluation of such initiatives in order to better assess their performance and welfare impacts. • Review found that local-level programs (like Microrregiones in Mexico and FONCODES in Peru) showed better results than regional-level initiatives (Plan Pacifico & Plan Puebla Panama)
CCT impacts on consumption poverty • CCTs have generally led to substantial reductions in consumption poverty—in particular, when transfers are large • In Nicaragua, the Red de Protección Social, a pilot program, reduced the poverty gap among beneficiaries by 18 percent • In Mexico, PROGRESA (now Oportunidades), a program with national coverage, reduced the poverty gap in rural areas by 19 percent
CCT impacts on health and education outcomes • Examples — education: • In Mexico, Oportunidades decreased dropout between 6th and 7th grade by 9% points • In Pakistan, the Punjab Education RSP increased the school enrollment of 10-14 year-old girls by 11% points • In Cambodia, two pilot programs reduced the dropout between 6th and 7th grade by 20-30% points • Examples — health: • In Colombia, Familias en Acción increased the proportion of children who had growth monitoring by 20-30% points • In Honduras, PRAF increased the proportion of children who had at least one preventive health visit by 20% points
CCT impacts on health and education outcomes • Because impacts are concentrated among the poorest households, CCTs have helped reduced “inequality of opportunities” • Example: Nicaragua
Checking on the Sensitivity of the Findings • How does the role of returns and characteristics in explaining welfare differences vary across the income distribution? • The Blinder Oaxaca decompositions used so far are only valid at the mean on lnPCE. Recently the BO method has been extended to different points of the distribution on lnPCE. • Brazil & Mexico: Quantile regression analysis • How does the role of returns and characteristics in explaining welfare differences vary over time? • Mexico 2006 vs. 1996 • Bottom Line: conclusions/results do not change. • Broadly consistent with the decomposition results at the mean
Welfare Differences Within RegionsBrazil: Metro vs Urban & Urban vs. Rural in SE & NE
Welfare Differences Across RegionsBrazil: SE vs. NE regions (metro, urban rural)