Download
1 / 35
350 likes | 527 Views
Division of Biometry and Risk Assessment. John Appleget Computer Specialist James Chen, Ph.D. Mathematical Statistician Yi-Ju Chen Post Doc Robert Delongchamp, Ph.D. Mathematical Statistician Ralph Kodell, Ph.D. Director Daniel Molefe, Ph.D. Post Doc

E N D
Division ofBiometry and Risk Assessment • John Appleget Computer Specialist • James Chen, Ph.D. Mathematical Statistician • Yi-Ju Chen Post Doc • Robert Delongchamp, Ph.D. Mathematical Statistician • Ralph Kodell, Ph.D. Director • Daniel Molefe, Ph.D. Post Doc • Bruce Pearce Computer Specialist • Susan Taylor Program Support Specialist • Angelo Turturro, Ph.D. Research Biologist • Cruz Velasco, Ph.D. Post Doc • John Young, Ph.D. Research Biologist • Qi Zheng, Ph.D. Staff Fellow
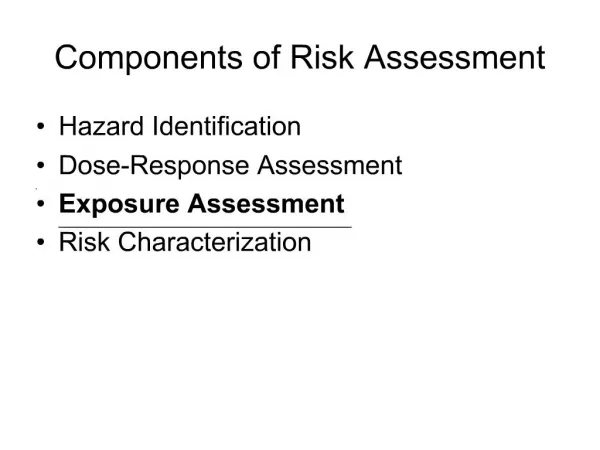
Research Highlights • Fumonisin B1 Risk Modeling • Cryptosporidium parvum Study • Cumulative Risk for Chemical Mixtures • Computational Toxicology • Photocarcinogenicity Theory & Methods • Analysis of cDNA Microarray Data • Staff Enrichment
Fumonisin B1 Risk Modeling Qi Zheng et al. • NTP IAG Study in rats and mice (P. Howard) • Liver tumors in female mice…kidney tumors in male rats • Directed/encouraged by Bern Schwetz • CFSAN, CVM • Two recommendations of SAB SVT • Project related to Food Safety Initiative • Project for intra-division collaboration
Female Mouse Liver Tumors • Adjusted tumor rates at 104 weeks • Hepatocellular adenoma or carcinoma Probability ppm
Mathematical Model • Use MVK two-stage, cell-proliferation model to predict probability of tumor at 104 weeks (t) 1 2 Normal N(t) Malignant Preneoplastic (t)
Hypothesis • Fumonisin B1 affects the incidence ofliver tumor formation in mice byincreasing the death rate of cellswhich leads tocompensatory proliferation.
Implementing the Model • Use allometric relationship between liver weight and body weight, LW(t)=a[BW(t)]b, to estimate theliver weight • Estimate the number of cells in the liver by N(t)=LW(t)/CW • Estimate the net growth rate of the liver using d[logLW(t)]/dt
Implementing the Model • Use PCNA data to estimate the cell birth rate,(t) • Estimate the cell death rate by(t)=(t)-d[logLW(t)]/dt
Implementing the Model • Relate differential effect of FB1on (t), and, consequently, (t) by level of sphinganine in liver • Infer mutation rates, 1 and 2, (constant w.r.t. FB1 and time) from tumor data
Female Mouse Liver Tumors • Tumor incidence at 104 weeks • Hepatocellular adenoma or carcinoma • Observed: .117,.065,.021,.427, .883 • Predicted: .091,.084,.105,.284, .992 Probability ppm
Male and Female Mouse Liver Tumors Male Observed: .268, .211, .190, .213, .213 Predicted: .199, .201, .198, .233, .237 Observed: .117, .065, .021, .427, .883 Predicted: .091, .084, .105, .284, .992 Female Probability ppm
Fumonisin B1 Summary • Data and model are consistent with hypothesis • FDA Workshop on Fumonisins Risk Assessment: February, 2000 • Food Additives and Contaminants, 2001 • FAO/WHO JECFA (Feb., 2001) used extensively in draft report on fumonisins …CFSAN (Mike Bolger) • Model kidney tumor risk in male rats?
Cryptosporidium parvum Study Angelo Turturro et al.E07082.01 • IAG with EPA-NCEA, Cincinnati - B. Boutin • Much input from CFSAN (R. Buchanan, G. Jackson, M. Miliotis) • New challenge for NCTR • Cryptosporidium parvum is a protozoan • Common contaminant of drinking water • Can also contaminate the food supply
Objectives • To develop a model for transmission dynamics of Cryptosporidium parvum in human outbreaks • To standardize the dose of Cp strains in the neonatal mouse (three isolates) • To establish an appropriate animal model • Brown Norway rat • Chemically supressed C57Bl/6 mouse (Dex)
Objectives (cont.) • To investigate subpopulations with varying degrees of immunocompetence • Three age groups - young, adult, elderly • Pregnant • Immunosuppressed similar to AIDS • Physiologically stressed - diet, exercise • Status: Protocol reviewed, revised, re-submitted
Cumulative Risk for Chemical Mixtures James Chen, Yi-Ju Chen et al.E07087.01 • IAG with EPA-NCEA, Cincinnati- G. Rice, L. Teuschler • Objective: To develop and apply a Relative Potency Factor (RPF) methodology for estimating the cumulative riskfrom exposure to a mixture of chemicals having a common mode of action (e.g., organophosphates: cholinesterase inhibition) FQPA, 1996
Specific Aims • To use an expanded definition of dose addition to develop a risk estimation method that does not depend strictly on parallelism of log-dose-response curves • To develop a classification algorithm for clustering chemicals into several constant relative potency subsets
Advantages • Uses actual dose-response functions of mixture components, not just ED10s, say (like TEF, HI, etc.) • If the RPF isconstant across all chemicals, then invariant to choice of index chemical • Can be used even when the RPF differs for different subsets of chemicals in the mixture • Status: Protocol in review
Computational Toxicology John Young et al. E07083.01 • Objective: To develop an expert computational system for prediction of organ-specific rodent carcinogenicity by applying structure activity relationships (SAR) in conjunction with data on short-term toxicity tests (STT) and nuclear magnetic resonance (13C-NMR) spectroscopy.
Motivation • FDA’s need to • bring safe products to market more quickly • screen out unsafe products reliably • CFSAN (M. Cheeseman) • streamline toxicity testing, e.g., require sponsor to conduct target-specific toxicity based on system’s prediction
Database • 1298 chemicals in Carcinogenic Potency Database • Group 1: carcinogenicity in liver • Group 2: carcinogenicity, but not in liver • Group 3: no carcinogenicity in any organ • Add data on SAR, STT and NMR
Database (cont.) • 392 NTP chemicals in CPDB • 342 positive in liver for 1 species-sex combo. • For good mix of positive/negative, might need to do • species-specific prediction • sex-specific prediction
Strategy • Training set • Use 392 NTP chemicals in CPDB • Testing set • Use 288 literature chemicals in CPDB • Use 282 pharmaceuticals in CDER database • 33 positive in liver for 1 species-sex combo. • Status: Protocol recently approved and implemented
Photocarcinogenicity Theory & Methods Ralph Kodell, Daniel Molefe et al. E07061.01 • FDA • CFSAN Cosmetics • CDER Drugs (K. Lin) • NCTR’s Phototoxicity Program (P. Howard) • CRADA w/ ARGUS Laboratory: S00213 • Post Doc funding through NTP: E02037.01
Statistical Approaches • Standard Testing Method • Logrank test for differences in distributions of time to first observed tumor • New Testing Method • Test for difference in number of induced tumors • Test for difference in distributions of time to observation of tumors
Accomplishments/Plans • Model developed for repeated-exposure case • Computational optimization procedure developed • Data on first of eight Argus studies analyzed • Compare to logrank and Dunson’s method • Status: Ongoing.
Analysis of cDNA Microarray Data Bob Delongchamp, Cruz Velasco et al.E07096.01 • cDNA Microarrays • popular new biotech tool • vast amounts of data on gene expression quickly • Statistical issues • Experimental design • Analysis and interpretation
Statistical Issues • Experimental design • Replication: arrays and genes • Data analysis • Adjustment for nuisance sources of variation • Appropriate methods for assessing differences • Adjustment for multiple comparisons • Identification of genetic profiles
Figure 1. Intensities observed in rat hepatocytes. Upper Right - Untreated Array Lower Left - MP Treated Array Lower Right - PM Treated Array
Figure 2. Array maps of log(Iga/Ig). Upper Right - Untreated Array Lower Left - MP Treated Array Lower Right - PM Treated Array
Figure 3. Intensities adjusted within 6x6 blocks. Upper Right - Untreated Array Lower Left - MP Treated Array Lower Right - PM Treated Array
Figure 4. Intensities adjusted for splotches (Ka) and saturation (K*a). Upper Right - Untreated Array Lower Left - MP Treated Array Lower Right - PM Treated Array
Objectives • Data analysis • Appropriate methods for assessing differences • Individual genes • Clusters of genes (profiles) • Adjustment for multiple comparisons • PCER, FWER, FDR • Status: Protocol in development
Staff Enrichment • Short courses and conferences • UCLA Functional Genomics (Chen) • IBS/ENAR Conference (Chen, Delongchamp, Kodell) • Gordon Conference on Bioinformatics (Zheng) • Genetic and Evolutionary Computation Conference (Pearce) • IAG with UAMS (R. Evans)
Staff Enrichment • Lab visits • Academia Sinica, Taiwan (Chen, 2 weeks) • Visualization, classification (C-H Chen) • Jackson Lab. (Delongchamp, 1 month) • Differential gene expression (G Churchill) • Visits to other FDA Centers • CDRH (Greg Campbell): Delongchamp, Velasco, Harris • Visiting scientists