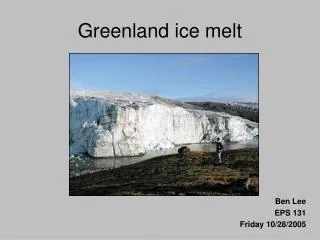
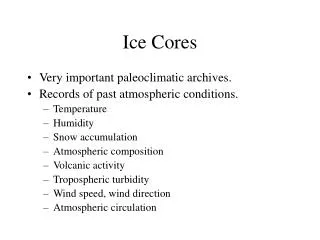
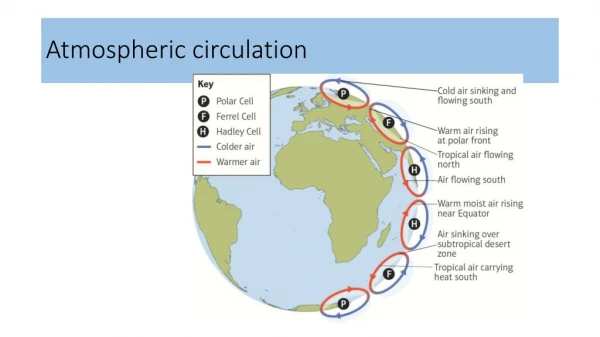
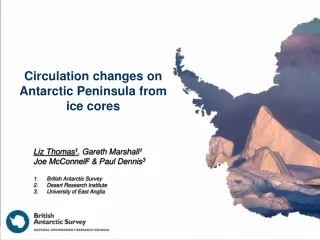
Abrupt changes in atmospheric circulation from Greenland Ice Cores
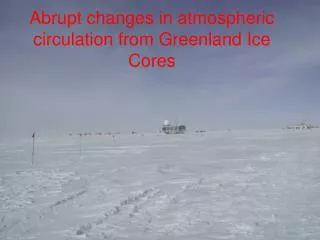
Abrupt changes in atmospheric circulation from Greenland Ice Cores. Greenland Summit Location. NSF Site = Summit Camp = GISP2 core European Site = True Summit = GRIP core. Summit is very FLAT. Elevation = 3200 meters Annual Mean Temperature about -30 C.

Abrupt changes in atmospheric circulation from Greenland Ice Cores
E N D
Presentation Transcript
Abrupt changes in atmospheric circulation from Greenland Ice Cores
Greenland Summit Location NSF Site = Summit Camp = GISP2 core European Site = True Summit = GRIP core
Summit is very FLAT Elevation = 3200 meters Annual Mean Temperature about -30 C
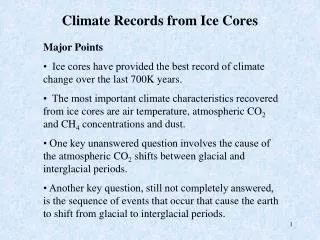
Evidence of Abrupt Climate Change- DO Events from GISP 2 Warmer • At least 20 DO (Dansgaard-Oeschger) events recorded in the last 120 Kyears (Rahmstorf, 2003) • Rapid warming followed by slow cooling then rapid cooling (Stuiver and Grooves, 2000) (Stuiver and Grooves, 2001) TIME
Composite of 13 DO events [Stuvier, 2000] Composite annual mean warming of 12 C Half point of transition reached in 2 years
Spatial Extent of DO Events-Non Atlantic • coincident changes in monsoon strength observed half way around the world • other proxy records indicate coincident climate changes Santa Barbara- oxygen 18 in n pachyderma THIS COULD BE CRAP! INCREASING MONSOON Time [Peterson, 2000]
Other things in the snow • Calcium Dust in air (insoluble suspended solids) • Sodium Sea Salts in air
Calcium (Insoluble dust concentration) Record [Fuhrer, 1999] Clear- abrupt changes in dust concentration across DO events -as temperatures warm, atmospheric dust load goes down
Scatter Plot of ice core oxygen isotope and calcium concentration Stadial (Cold) Data Points Interstadial (Warm) Data [Fuhrer,1999] • Temperature (oxygen isotopes) overlap between regimes but calcium does not • CLIMATE REGIME IS BEST CHARACTERIZED BY ATMOSPHERC DUST LOAD – FACTOR OF 10 change
The dust burden could change by ------------------------------------------------- [Svenson, 2000] • Change in source area • Change in size of source area • Change in atmospheric transport time • Change in atmospheric residence time • Change in magnitude of flux from source to atmosphere- [WINDS OVER SOURCE] --------------------------------------------------------------- [Fuhrer, 1999]
Dust Diameter across DO events Modal Dust Diameter Interstadial (warm) Staidal (cold) [Ruth, 2003] Dust concentration More Dust = Larger Dust BUT Changes in dust diameter are not nearly as big [stadials and interstadials overlap] DIFFERENT PHYSICAL MECHANISMS IN CLIMATE SYSTEM ARE AT PLAY
What changes diameter of dust • Winds over source region • Change in residence time • Change in transport time from source to deposition • ------------------------------------ affects concentration but not size distribution ----------------------------------------- doesn’t change dry deposition Suggests transport was 1.5 times faster during cold stadials
Sea Salt concentration change [Mogenson, 2002] Sea salts were 2x greater during cold stadials
What could change sea salts • Storms in the Atlantic Likely up during cold stadials • Residence time (strength of wet deposition) Change in sea salt concentration (2X) give upper bound on the change in residence time between stadial and interstadial
The dust burden could change by ------------------------------------------------- [Svenson, 2000] • Change in source area • Change in size of source area • Change in atmospheric transport time • Change in atmospheric residence time • Change in magnitude of flux from source to atmosphere- [WINDS OVER SOURCE] --------------------------------------------------------------- [Fuhrer, 1999] X 1.5 (size) X 2 (salts) Must have changed by factor of 3-4 to explain X10 change in total dust (30%-40% change in spring time winds over Asia)
Conclusions • Ice cores show rapid, concurrent changes in temperature, dust load, dust grain size and sea salts • Dust load changes can only be explained by changes in atmospheric circulation which are hemispheric in extent • Any proposed mechanism should explain the dust data