Download
1 / 46
470 likes | 886 Views
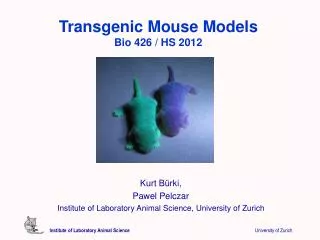
Issues and Experience in Analyzing Transgenic Mouse Carcinogenicity Studies: An Industry Perspective. Ronald Menton Wyeth Research. 2005 FDA/Industry Statistics Workshop Washington, DC, 14-16 Sep 2005. Outline. Some statistical questions for 2-year studies Transgenic models

E N D
Issues and Experience in Analyzing Transgenic Mouse Carcinogenicity Studies: An Industry Perspective Ronald Menton Wyeth Research 2005 FDA/Industry Statistics Workshop Washington, DC, 14-16 Sep 2005
Outline • Some statistical questions for 2-year studies • Transgenic models • Some thoughts on the questions for transgenic models • Final Comments
Study Design Questions? • Are two control groups needed? • How many animals per group? • What groups are needed? • Statistical methods?
Some In-Life Questions? • When should we terminate group x? • When should we terminate the study? • Do we have a valid study?
Questions at End of Study? • DO WE HAVE A VALID STUDY? • ARE ANY FINDINGS STATISTICALLY SIGNIFICANT?
Transgenic Mouse Models • Mouse model more susceptible to drug-induced tumors due to • Knocking out gene associated with tumor suppression (eg., p53+/-, XPA-) • Insertion of multiple copies of human gene associated with tumor promotion (eg., TgrasH2,TG.AC) • The increased signal permits shorter study duration and smaller group sizes
Transgenic Models • Current Regulations (ICH S1B) permit sponsors to conduct the traditional 2 year rat study plus a short- or medium-term rodent study in lieu of 2 year studies in both rats and mice • The Committee for Medicinal Products for Human Use stated that the TgrasH2 and p53+/- mouse models are acceptable alternatives to the 2-year mouse study. CPMP (2004)
Why Conduct Transgenic Study? • Faster • In-life: 6-months vs 2 years • Study completion: 1 year vs > 3 years • Less Resources • Fewer animals • People • Space • Increased Flexibility for Drug Development
Are Two Control Groups Needed? • Many companies routinely use two vehicle control groups for 2-year carcinogenicity studies. • Why? • Permits an assessment of variation in tumor rates between groups • Poor survival in control group is problematic • See Haseman (1990) for discussion
Multiple Control Groups in 2-Year Studies Eight of 14 companies indicated that multiple control groups are employed for at least 75 % of their studies. What type of multiple control group designs are routinely used? 9 Two vehicle control groups 2 Vehicle control and water control 2 Vehicle control and untreated control Survey of 14 PhRMA Companies on Statistical Methods Used for 2-year Rodent Carcinogenicity Studies. Menton R (2003)
Are Two Control Groups Needed? • Are Two Vehicle Control Groups Needed in Short-term Carcinogenicity Studies? • Not for most models • Low spontaneous rate of tumors • Survival rate usually high for at least 6 months
Survival for P53 Mouse from 6 NTP Studies NTP Web Site
Spontaneous Tumors in P53 Mice Adapted from NTP Website
Spontaneous Tumors in TgrasH2 Mice • Usui (2001) summarized tumor incidence and time of first tumor for common spontaneous tumors (incidence > 1%) in 12 ILSI ACT studies. • 180 male and 178 female mice (15 per study/sex) • Male tumor incidence: 0 – 1.8% • Female tumor incidence: 0 – 2.3% • In most cases, the incidence of these common tumors was only marginally greater than 1.0%
How Many Animals Per Group? • 2-year mouse studies typically use between 50-65 animals per group. • Study duration was typically 24 months for both rat and mouse studies. The number of animals per group per sex was evenly divided between 50, 60, and 65.
How Many Animals Per Group? • Original ILSI protocols recommended 15 animals per group for transgenic studies • Recent papers and presentations have recommended 20-25 per group • Morton (2002) • Lin (2004) • CPMP (2004)
Sample Size • Recommend 20 to 25 mice/sex/group for carcinogenicity assessment studies in TgrasH2 mice. (Morton 2002) • Group size of 15 animals in the original transgenic mouse study protocol is too small. To have a level of power between 80 and 90% in detecting a true 15% difference, 20-25 animals per group are needed. (Lin 2004) • The number of animals per group in the ILSI/HESI studies is too small. An increase in group size to 20-25 animals per group is recommended. (CPMP 2004)
Power to Detect Selected Increases in Tumor Rate Assuming Background Tumor Rate Near 0
What Groups to Include? • Typical 2-year carcinogenicity study includes 5 groups: C1, C2, L, M, H • All but one respondent indicated that a typical study includes three dose groups, with one stating that they usually employ four dose groups.
What Groups to Include? • Original ILSI Protocol recommended 7 Groups • C, L, M, H, Positive Control, WT-C, WT-H • WT groups are now considered optional • Two questions: • Is the PC control group needed? • If PC group included, then how many animals are needed in this group?
Positive Controls in Short-term Studies • Storer (2001) summarized results for 19 ILSI ACT studies that used p-cresidine as the positive control group • N=15 per sex • Males • P-cresidine was considered positive for 18 of 19 studies • Bladder tumor incidence ranged from 0 to 86.7% • Females • P-cresidine was considered positive for 15 of 19 studies • Bladder tumor incidence ranged from 0 to 60%
Power for Comparing Tumor Incidence Between Positive Control and Vehicle Control Group
Statistical Methods? • Eleven of 13 respondents familiar with the procedures detailed in the draft FDA guidance document, “Statistical Aspects of Design, Analysis, and Interpretation of Animal Carcinogenicity Studies”. • Twelve companies stated that they are using Peto type tests for the analysis of tumor data. • Peto’s test is commonly used for the statistical analysis of tumor data for 2-year carcinogenicity studies
Options for Statistical Methodology forP53 and TgrasH2 Studies • Cochran-Armitage Trend test and Fisher’s Exact test Exclude animals that die with short survival times. Definition of sufficient survival based on time of tumor observation in sponsor’s historical data and literature • Peto Methods • Poly-K methods
Cochran-Armitage and Fisher Exact Tests Advantages • Simple, well known test • Exact tests available • Easy to block or stratify for other covariates • Appropriate if there are few fatal tumors and intercurrent mortality is similar among groups Disadvantages • Requires specification of survival time for excluding animals • Does not account for time of tumor onset or cause of death
Peto Methods Disadvantages • Requires specification of incidental intervals • Specification of incidental intervals is complicated due to small number of deaths in vehicle control groups • Complexity makes stratification/blocking more difficult Advantages • FDA may use Peto’s method • Accounts for time of tumor onset and cause of death • Software available • Exact tests available • Scientists familiar w/ methods
Poly-K Methods Advantages • Adjusts for mortality • Does not require cause of death determination • Do not have to specify time intervals • Easy to block or stratify for the two studies • Fairly simple method Disadvantages • Not much experiece for 6-month study • Biologists not familiar with method • Application of exact tests for poly-k method is a research topic
Statistical Methods? Incidence of mortality, neoplasms/select non-neoplasms will be compared among dosage groups using the Cochran-Armitage trend test and Fisher's exact test between each dosage group and the vehicle-control group. If excessive intercurrent mortality is observed then the trend and pairwise tests of tumor data will be conducted using Peto's method. What constitutes excessive mortality? Number of early deaths: > 5? > 10? Employ Poly-k Method?
Questions During In Life • Mortality and/or differential intercurrent mortality raises statistical questions during conduct of 2-year studies • Should the high dose be lowered? • Should one or more groups be terminated early? • Should the study be terminated early? • Ten of 13 companies indicated that at least one dose group was terminated early or the top dose lowered for at least one study in the past five years.
Mortality Guidelines for 2-year Studies • 20-30 animals per group should be alive during weeks 80-90 • FDA Draft Guidance (May 2001) • High-Dose group could be terminated early when the survival of the group is reduced to 10-12 animals • Fairweather et al (1998). Drug Information Journal • A study could be terminated if survival of the control group goes below 20-30 after weeks 80-90 • FDA Draft Guidance (May 2001)
Mortality Issues for Short-term Studies • Survival is usually very high in short-term studies • However, what do we do if it isn’t? • What are the criteria for evaluating if study is acceptable, terminating a study, or terminating a dosage group?
Mortality Issues for Short-term Studies • We (scientific community) do not currently know how many animals are needed at the end of a 26-week carcinogenicity study • We also do not know how many weeks represents sufficient exposure • We do know that the more animals per group the more sensitive the statistical tests will be for detecting compound related tumor increases of a specified magnitude
Description of Power Calculations • Simulations were conducted to estimate the probability of detecting differences of 15 - 35% in tumor rates between the treated groups and control group • Power calculations assume that tumor incidence is compared among 4 dosage groups using a one-sided Cochran-Armitage trend test conducted at the 5% significance level • Background tumor incidence ranged from 0.1% to 3% • Tumor incidence in L and M dosage groups ranged from background rates to 2/3 of that in H dosage group • Power was computed via simulation (1000 runs per simulation) • Calculations performed for two sets of samples sizes:25, 24, 22, and 15 in the C, L, M, and H dosage groups, 25, 24, 22, and 10 in the C, L, M, and H dosage groups,
Some Thoughts On Mortality Guidelines for Short-term Studies • xx-yy animals per group should be alive during weeks ww-zz • xx - yy = 15 – 20? • ww-zzlikely species dependent • High-dose group could be terminated early when the survival of the group is reduced to 10-15 (?) animals before weeks ww-zz. • A study could be terminated if survival of the control group goes below 20 (assuming n = 25) before weeks ww - zz
Are Any Findings Statistically Significant? • What is Considered Statistically Significant? • Different approaches are utilized to adjust for the multiple statistical tests performed in 2-year carcinogenicity studies. • Six of 13 companies employ the decision rule in FDA’s draft guidance document of 0.025 for rare tumors and 0.005 for common tumors. What significance levels are used for the evaluation of rare/common tumors? Rare/Common 4 0.05/0.05 with no adjustments for multiple tumors 1 0.05/0.05 with an adjustment for multiple tumors 2 0.05/0.01 i.e., Haseman Rule 6 0.025/0.005 i.e., FDA Decision Rule
Decision Rule in FDA’s Draft Guidance Adapted from US FDA (May 2001)
What is Considered Statistically Significant? • Is a multiplicity adjustment needed for short-term studies? • No • Only a handful of tumor types observed in a study • Probability of a false positive is low due to low spontaneous rate
Final Comments • Alternative mouse models provide additional flexibility in drug development • While 25 animals per sex/group is reasonable for the control and treated transgenic groups, smaller sample sizes make sense for the positive control group • Simple statistical methods work well when survival is high • More research and/or guidance is needed on defining adequate survival
Some References • CPMP Safety Working Party. CHMP SWP conclusions and recommendations on the use of genetically modified animal models for carcinogenicity assessment. London, 23 June 2004. • Haseman JK, Hajian G, Crump KS, Selwyn MR, and Peace KE, Dual controls in rodentcarcinogenicity studies. In: Statistical issues in drug research and development, Ed by KE Peace. Marcel Dekker, New York. 1990. • Lin K. Statistical Issues in Review of Carcinogenicity Studies of Pharmaceuticals, Drug Information Association 40th Annual Meeting, June 16, 2004, Washington, DC • MacDonald J, et al. The utility of genetically modified mouse assays for identifying human carcinogens: a basic understanding and path forward. Toxicol Sci. 2004:188-94. • Menton R. and R Perry. Statistical Methods for 2-Year Rodent Carcinogenicity Studies. Midwest Biopharmaceutical Workshop, Muncie, In, 2003. • Morton D. The Tg rasH2 Mouse in Cancer Hazard Identification, Toxicol Pathol, 2002: 139-146. • NTP web pages on Histoical Controls for P53 Mice. http://ntp.niehs.nih.gov/Study Results & Research Projects >> Study Data Searches >> Historical Controls >> NTP Historical Control for Genetically-Modified Models • Storer R, et al. p53+/- Hemizygous Knockout Mouse: Overview of Available Data. Toxicol. Pathol.,2001, 29 Suppl:30-50. • Takaoka M, et al. Interlaboratory comparison of short-term carcinogenicity studies using CB6F1-rasH2 transgenic mice. Toxicol Pathol, 2003:191-9. • US Food and Drug Administration, Statistical Aspects of Design, Analysis, and Interpretation of Animal Carcinogenicity Studies, Draft Guidance for Industry, May 2001. • Usui T, et al., CB6F1-rasH2 mouse: Overview of Available Data. Toxicol Pathol, 2001. 29 Suppl:90-108.