Download
1 / 89
900 likes | 1.03k Views
Understanding Urban Pollution and the Role of Diesel Exhaust: Emission Sources. Bart E. Croes Chief of the Research Division California Air Resources Board Presentation to: Centre for Science and the Environment New Delhi, India November 2000. Presentation Outline. I. Background

E N D
Understanding Urban Pollution and the Role of Diesel Exhaust:Emission Sources Bart E. Croes Chief of the Research Division California Air Resources Board Presentation to: Centre for Science and the Environment New Delhi, India November 2000
Presentation Outline • I. Background • II. Inventory Examples • Mobile - diesel NOX & PM • Area - dust • Point - power plant • III. California’s Experience • IV. Reconciliation
India’s Pollution Potential • Second largest population in world • Although 26% of population lives in cities, India has more than 30 cities with population greater than 1 million • Tenth largest economy in world
Example of India’s Growth • NOX emissions expected to double during each of the next 2 decades • India’s NOX emissions projected to increase from 18% of Asiatic total in 1995 to 26% of total in 2020 • This large increase despite rapid growth throughout Asia
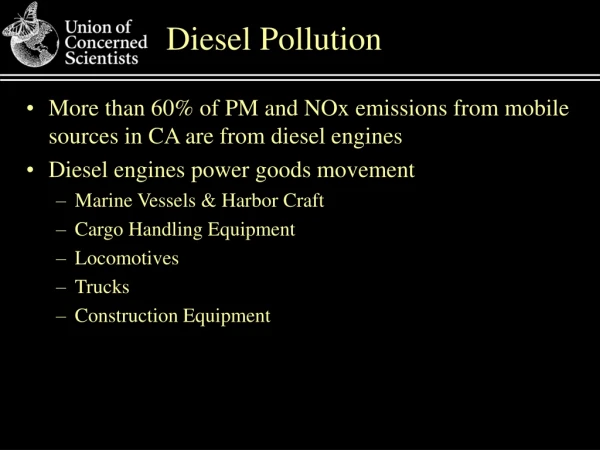
Example of India’s Sources • Transportation sector expected to account for 58% of NOX emissions in 2020; 90% of this from diesel • Second largest category, LPS, will account for 19% of 2020 inventory
Building an Air Quality Plan Clean Air Control Strategy Air Quality Modeling Emission Inventory Air Quality Monitoring
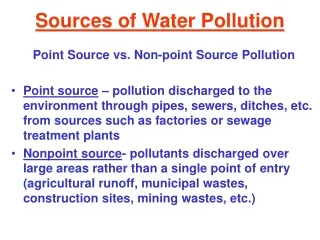
Emission Inventory “Is a comprehensive listing of the sources of air pollution and an estimate of their emissions within a specific geographic area for a specific time interval.”
Critical Steps and Usesof an Emission Inventory include: • Identifying pollutants of concern • Identifying sources of pollution • Characterizing emissions • Identifying control strategies
Types of Inventories • Annual average • Seasonal inventories • Forecasted - future estimates • Gridded / Modeling
Criteria Pollutants: TOG - total organic gases ROG - reactive organic gases CO - carbon monoxide NOx - oxides of nitrogen SOx - oxides of sulfur PM10 - PM < 10 microns PM2.5 - PM < 2.5 microns
Pollutants:Toxics • Diesel PM • Benzene • 1,3 Butadiene • Formaldehyde • Hexavalent chrome • Perchloroethlyene (PERC) • Lead
StationarySources • Refineries • Manufacturing • Food processing • Electric utilities • Chemical production
Area-WideSources • Farming • Paved & unpavedroad dust • Solvents • Consumerproducts • Open burning
Mobile Sources • Cars • Trucks • Buses • Aircraft • Trains • Ships
Non- anthropogenic • Wild fires • Biogenics • Windblown Dust
Developing Emission Inventories • Planning for inventory development • Data collection • Data management and reporting
Selection of Methods • Intended use of inventory • Availability of data • Practicality of method • Priority of category • Time/Resources
Methodologies • Top down approach • Continuous emission monitors • Source testing • Material balance • Emission factors • Fuel analysis • Surveys • Engineering judgement
Estimation Models • BEIS (biogenics) • Landfill Gas Emission Model • TANKS (storage tanks) • MECH (PM emissions form road, ag.) • PM Calc (PM2.5 emissions) • MOBILE6 / EMFAC2000 • OFFROAD Model
Where to Find Information • Emission Inventory Improvement Program (EIIP) • 10 volumes of methods • California Air Resources Board • Area Source Manual • Speciation Manuals • CATEF toxic emission factors • U. S. EPA • CHIEF clearinghouse • Fire Database (toxic factors)
Process Rate (Activity) EmissionFactor Emissions x = Number of Units Emissions per Unit = Total Emissions x Calculate Emissions
Data Collection • Activity data • Emission factors • Facility information • Spatial and temporal • Speciation
Data Quality Objectives • Accuracy/uncertainty • Completeness • Representativeness • Comparability • Consistency • Reasonableness
Documentation • Methods used • Sources of data • Assumptions • Calculations • Communication
Data Reporting • Annual average • Seasonal • Forecasted • Gridded/modeling
Mobile, Area, and Point Sources • Mobile - Cars, trucks, tractors • Area - Dust from land preparation, windblown dust, unpaved road dust, pumps • Point - Processing facilities
How to Examples • Mobile - diesel • Area - agriculture • Point - power plant
Emissions Inventory Development • Basic Equation • Pop*Activity*Emissions = tons/day • Number of Sources (vehicle population) • Activity (miles or kilometer per vehicle) • Emission Rate (grams per mi. or km.)
Vehicle Activity(Miles per Vehicle per Day - Source: Mobile5)
Emission Factors(Source: Mobile5) Deterioration Rate Increase in Emissions As a Function of Usage (Zero Mile or Intercept)
1998 Oxides of Nitrogen Emissions(Gasoline Powered Vehicles - 119.7 TPD)
1998 Particulate Emissions(Gasoline Powered Vehicles - 19.39 TPD)
1998 Oxides of Nitrogen Emissions(Diesel Powered Vehicles - 74.99 TPD)
1998 - NOX Emissions NOX Emissions = 107,500 tons/day
1998 - PM10 Emissions PM10 Emissions = 58,200 tons/day
How to Examples • Mobile - diesel • Area - agriculture • Point - power plant
Overview of Estimation Methodology • Emission Factor(EF) • Emissions per unit of activity (i.e., lbs/PM10 per acre tilled) • Activity Data(Process Rate, PR) • Vehicle Miles Traveled, Acre-Passes • Emissions • Emissions = EF x PR
Inventoried Agricultural Emission Sources • Field & orchard operations (dust) • land preparation & some harvesting • Windblown dust • fields and unpaved roads • Unpaved roads & unpaved areas • Farm equipment exhaust • mobile & stationary
Inventoried Agricultural Emission Sources (continued) • Open burning • prunings, residue, weeds • Industrial point sources • Processing • Cotton processing and handling • Packing • Pesticides
Agricultural Emissions Summary Emissions data from 1996 emissions inventory.
Current Inventory Shortcomings • Cultivation practices not included • Most harvest activities not included • Land preparation estimates not activity specific (e.g., discing, planing) • Unpaved road dust estimates generic • Unpaved staging and parking areas not included
Current Inventory Shortcomings (continued) • Soil conservation practices not included • Effects of dust deposition not included • Ammonia sources not included • Biogenics not included
Quantifying Emission Estimatesfor Alternate Practices • Effects on activity data • acre-passes • vehicle miles traveled • Effects on emission factors • natural gas vs diesel • mulching vs burning • equipment differences • moist vs dry soil • Control effectiveness & penetration
Issues for Incorporating Alternative Practices • Seasonal exceedances • Do changes help when air quality is poor? • Location specific exceedances • Are the changes in a region with poor air quality? • Benefit from baseline emissions • Do the changes produce a reduction from baseline estimates?
Control Options • Find ways to reduce Emission Factor • soil or unpaved road stabilization • limit activities under high emitting conditions (such as high winds) • control equipment, cleaner engines, cleaner fuels • cleaner equipment, etc. • Reduce Activity Data • minimize unpaved road travel • minimize land preparation passes • perform activities when less air impacts