Download
1 / 41
410 likes | 525 Views
A Ten Year Study of Nitrate Leaching in Vegetable Production With Winter Cover Crops. Thesis Defense Jeff Feaga M.S. Bioresource Engineering. Outline of Talk. Part 1 - Methods Common to the Entire Study.

E N D
A Ten Year Study of Nitrate Leaching in Vegetable Production With Winter Cover Crops Thesis Defense Jeff Feaga M.S. Bioresource Engineering
Outline of Talk Part 1 - Methods Common to the Entire Study. Part 2 - Ten years of nitrate leaching below vegetable plots with and without cover crops. Part 3 - Spread of conservative, non-absorbing, and soluble tracers through field soils.
Three Key Points One • Winter cover crops are a successful BMP for nitrogen management in the Willamette Valley Two • Variations in rainfall timing and intensity greatly affect the spread of solutes. Three • The ADE is limited as a tool for predicting the spread of chemicals in soil.
Winter Methods • Location/Climate – • North Willamette Research and Extension Center (NWREC) Aurora, Oregon • Maritime Climate: 104 cm of rainfall/year. • Soils – Woodburn and Willamette Variant Loam. • Management – • Summer Vegetables • Cover Cropped (H) Fallow (C) • Three Fertilizer Rates (N0, N1, N2)
Mario Hudson Jaechul Florian Jeff Utility Players Vegetables and Cover Crops
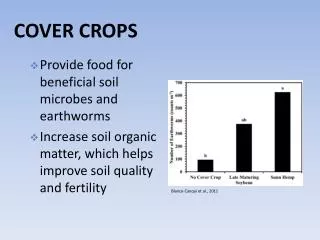
Winter Cover Crops Separating the cereal rye from the common vetch Common vetch Do legumes scavenge nitrate?
The Flow Weighting Process Total Mass Solute ________________ Total Volume Water
Part II – Nitrate Leaching Results Sampler Collection Efficiency Brandi-Dohrn et al. (1996) • First two winters • 76% collection Efficiency This Analysis • Winter 1993, 1999, and 2001 • Also a 76% collection Efficiency
C Plots = 17.1 mg/L Average Concentrations: H Plots = 11.4 mg/L Flow Weighted Averages: N2 Plots Equal to 80 kg/ha/year or 71 lbs/acre/year
One Tailed Paired T-tests: P-Value Distribution Concentration Mass
Mass Losses Under Legumes: Mineralization? Mass N03-N
May 2001 Soil Sampling: Chemical Profiles Residual Nitrate From Summer 2000 Br-from Dec 2000 Application
385 days Crop Treatment and Br- Tracer Recovery C Plots 42% H Plots 32%
Cover Crops Are Effective Nitrate Scavengers Concentration • - 34% lower under N2 cover cropped plots than fallow plots during cereal years , (p = 0.05) Mass losses • - 43% lower under N2 cover cropped plots than fallow plots during cereal years , (p = 0.05) Rainfall timing and amount • - influence concentrations, especially on the following year’s results. Legumes assimilated NO3 and Br • - More data needed to test ability for long-term scavenging
Switching Focus Part 3 – • Transport of conservative, non-absorbing, and soluble tracers through field soils. • Three applications • How is this study different? • Structured field soils • Natural rainfall • Sampling methods – PCAPS enable measurement of flux concentrations, don’t require positive or applied pressure for sampling.
ADE Which Parameters to Focus On? C (z, t) = Concentration (mg/L) Dhd = Hydrodynamic Dispersion: Molecular Diffusion + Mechanical Dispersion (Both in cm2/s) Vw = Pore Water Velocity
The Three D’s Note* D0 is a constant
a = 3.74 cm a = 20.6 cm a = 15.8 cm 3 Average Breakthrough Curves 1992 Br - 1995 Cl- 2000 Br-
Distribution of a Values They definitely do not appear to be constant!
Dispersion is a function of scale Blue = Bromide 2000 Red = Chloride 1995 Green = Bromide 1992
Rainfall Varied November 1992 November 1995 December 2000
131 days 440 days 1992 Br-: a = 0.02 cm Sampler # 17 1 Pore Volume 1 Pore Volume 1995 Cl- a = 49.9 cm Sampler #6
How Important is Molecular Diffusion? Peclet Number Analysis • Typically, D0 is not considered: True? d = characteristic length controlling transport **Using Average Velocity Calculated From PCAPS Flux
Distribution of Experimental Peclet #’s 10 cm Ped Controlled 5 cm Ped Controlled Bear (1972) 1 cm Ped Controlled Characteristic length IS at Ped Scale!
Can PCAPS aValues Predict the Spatial Concentration Profile? Sampler #20
Temporal Correlation of a? Do Samplers Consistently Fit a Values Above or Below the Mean? • Null Hypothesis: Three normalized a Values came from a population with a mean of 1. • Only six samplers fit the alternative hypothesis. Result: The group of a Values Have No Correlation in Time • Exceptions: Samplers measuring the lowest and highest a values
Spatial a Distribution Filliben test:Significant Log-Normal Distribution of a Values in Space
Tracer Transport Conclusions • Variation in a: • not explained by velocity: rainfall cycles and periods between diffusion and dispersion dominated transport. • Soil Structure • Transport processes reflect the soil ped structure, not grain size. • Prediction of tracer spread • The main parameter of the ADE controlling solute spread is not constant in time and space. As we implement it, the ADE is not capable of accurate transport predictions in natural conditions.
The Scientific Value of Long Term Experiments: • 10 Years of NWREC experiments were the minimum to understand this soil system. • Nature is highly variable, so cover crop experiments of a couple of years may not lead to the true conclusions. • Laboratory and fast breakthrough tracer experiments rarely represent field conditions. • How can we measure temporal aspects of model parameters if long-term studies are not funded?
Thanks! • My major professor John Selker for his devotion to his students, his intense interest in hydrology, and his love of practical solutions. • My committee: Richard Dick, Marshal English and Mike Gamroth • USDA, USGS, EPA and the ODA for funding contributions • The ODA for funding this particular analysis. • All of the former students and Bob Christ that worked collecting data • Joan Sandeno for all the chromatographic analysis and organizing the harvests • Del Hemphill for doing all the farmin’ and welcoming new members into the PCAPS club at the NWREC. • Yutaka Hagimoto for his help FINDING the PCAPS and soil sampling. • All of the folks in Gilmore hall, especially Dave and Kristy, who make work far better than bearable.