Download
1 / 4
40 likes | 53 Views
PMIs From Europe Paints a Grim Picture, What's Next?

E N D
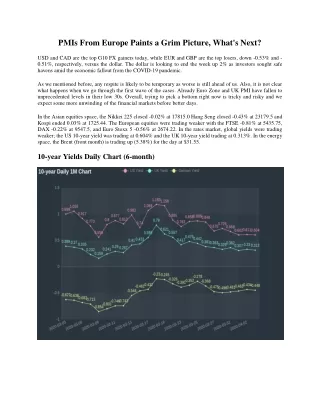
PMIs From Europe Paints a Grim Picture, What's Next? USD and CAD are the top G10 FX gainers today, while EUR and GBP are the top losers, down -0.53% and - 0.51%, respectively, versus the dollar. The dollar is looking to end the week up 2% as investors sought safe havens amid the economic fallout from the COVID-19 pandemic. As we mentioned before, any respite is likely to be temporary as worse is still ahead of us. Also, it is not clear what happens when we go through the first wave of the cases. Already Euro Zone and UK PMI have fallen to unprecedented levels in their low 30s. Overall, trying to pick a bottom right now is tricky and risky and we expect some more unwinding of the financial markets before better days. In the Asian equities space, the Nikkei 225 closed -0.02% at 17815.0 Hang Seng closed -0.43% at 23179.5 and Kospi ended 0.03% at 1725.44. The European equities were trading weaker with the FTSE -0.81% at 5435.75, DAX -0.22% at 9547.5, and Euro Stoxx 5 -0.56% at 2674.22. In the rates market, global yields were trading weaker; the US 10-year yield was trading at 0.604% and the UK 10-year yield trading at 0.313%. In the energy space, the Brent (front month) is trading up (5.38%) for the day at $31.55. 10-year Yields Daily Chart (6-month)
Daily FX Pivots Brent Crude Daily Chart (1-month) (Content and Data by Tradermade)
Forex Chart and Technical Analysis EURUSD Chart (Two-week) Strategy: Resistance at 1.0882 for 1.0648Short-term view: EUR/USD resistance comes in at 1.0882, MACD crossover suggests a bearish bias and RSI is below 50. Hence we see a downside to 1.0648. Above 1.0882 to open 1.0944 GBPUSD Chart (Two-week) Strategy: Support at 1.2407 for 1.2212Short-term view: GBP/USD resistance comes in at 1.2407, MACD crossover suggests a bearish bias and RSI is below 50. Hence we see a downside to 1.2212. Above 1.2407 to open 1.2466
USDJPY Chart (Two-week) Strategy: Support at 107.67 for 108.74Short-term view: USD/JPY support comes in at 107.67, MACD crossover suggests a bullish bias and RSI is above 50. Hence we see an upside to 108.74. Below 107.67 to open 107.24 AUDUSD Chart (Two-week) Strategy: Resistance at 0.6062 for 0.5950Short-term view: AUDUSD resistance comes in at 0.6062, MACD below zero and RSI is below 50. Hence we see a downside to 0.595. Above 0.6062 to open 0.6117 Contact Tradermade for Stock Charting Software