Download
1 / 80
810 likes | 1.1k Views
The National Resource Center for Family Centered Practice. Established in 1984 as a national consulting division of the University of Iowa School of Social Work Research, Evaluation, Technical Assistance, Training & Organizational Development

E N D
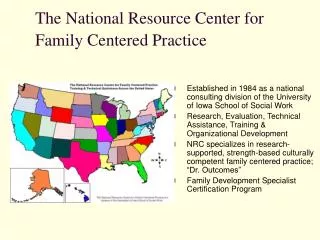
The National Resource Center for Family Centered Practice • Established in 1984 as a national consulting division of the University of Iowa School of Social Work • Research, Evaluation, Technical Assistance, Training & Organizational Development • NRC specializes in research-supported, strength-based culturally competent family centered practice; “Dr. Outcomes” • Family Development Specialist Certification Program
A Strength- Based Culturally Competent Approach to Reducing D.M.C. Patricia Parker, Senior Training Associate National Resource Center for Family Centered Practice University of Iowa School of Social Work 100 Oakdale Campus, W206 Oakdale Hall Iowa City, Iowa 52242 Phone: 319/335-4965 Email: pa_parker@msn.com
AGENDA I Introductions: Goal for the day II Reducing Racial and Ethnic Disparities in the in the Juvenile Justice System • What’s being done? • Why are they successful? III Thinking Shifts • Core philosophies that facilitated change • Lessons learned IV Practice Shifts • Where to start? (in- system/out-system) • What is the solution to the problem? • How to do it? (Action Plan) • Defining success. Next Steps.
Recent Publications on Reducing DMC • No Turning Back : Promising Approaches to Reducing Racial and Ethnic Disparities Affecting Youth of Color in the Justice System; A Project of the Building Blocks for Youth Initiative, October 2005 • Seven Steps to Develop and Evaluate Strategies to Reduce Disproportionate Minority Contact (DMC) Juvenile Justice Evaluation Center Guidebook Series Office of Juvenile Justice and Delinquency Prevention Juvenile Justice Evaluation Center Justice Research and Statistics Association
Recent Publications on Reducing DMC • Guidebook for Integration and Coordination of Child Welfare and Juvenile Justice Systems (Wiig & Tuell 2005). CHILD WELFARE LEAGUE OF AMERICA • Disproportionate Minority Contact in the Juvenile Justice System CHILD WELFARE LEAGUE OF AMERICA
What’s being done? • Santa Cruz, CA and Multnomah County, OR as part of JDAI, county officials lead they way in creating reforms in their detention process and probation department. • Seattle, Baltimore, Cook and Peoria Counties in IL, Louisville, San Francisco, and San Jose use the W. Haywood Burns Institute model involving a “stakeholders” Advisory board and data to effect change in the police department booking protocol. • Massachusetts developed an Advocacy Campaign • In Pennsylvania, three advocacy group form a partnership, use OJJDP relative Rate Index to collect and study data. The Youth Law Center, one of the Partners will use the data collected to develop targeted advocacy for DMC reform. • In Illinois the Juvenile Transfer Advocacy Unit used research and collaborative efforts to wage a successful campaign to challenge a law that automatically transferred 15-16 year olds accused of drug crimes to adult court. • In Maryland they close down a detention facility.
“ We stopped looking at what was wrong with the kids and trying to fix them. Instead, we looked at ourselves and tried to fix the system. The result was a better use of resources, better behavior by the kids and reductions in racial and ethnic disparities.” Scott MacDonald, Director of Juvenile Probation, Santa Cruz, CA from No Turning Back, 2005
Exercise #1: Introductions • Divide into 5 groups ( count off by 5) • Choose a facilitator, Time keeper and Presenter • Share with your group your name your county, city and state. • Discuss your DMC challenges and strategies. (For the Iowa participants you may refer to the Relative Rate Table from the NRC website ) • Make a list of what has worked and what remains a challenge in your efforts • Present your results
In the twenty-seven years I have worked at the Youth Law Center, the most pervasive, difficult, and intractable problem I have seen nationwide is racial and ethnic disparities faced by youth of color in the justice system. Mark Solar, No Turning Back, 10/2005
Pillars, Paradigms and Philosophies • Identifying/owning that problems exist • Working hard on a strategy that is: • Cultural Competence • Strength Based (identifying and using assets) • Solution Focused- Change Focused • Community-based Collaborative efforts • Data driven activities • Evaluating results
Strategies for Reducing Disparities in the Juvenile Justice System Ashley Nellis; Seven Steps to Reducing DMC , 2005 • Step One: Define the Problem • Step Two: Implement Evidence-Based Programming • Step Three: Develop Program Logic • Step Four: Identify Measures • Step Five: Collect and Analyze Data • Step Six: Report Findings • Step Seven: Reassess Program Logic
The Art And Science of Effective Technical Assistance Richardson & Thomas 5/2005 I The Art a) Do Your Homework b) Sensitive Issue c) The Message and the Messenger d) Credibility e) Engaging Detractors and Supporters f) Continual Feedback.. II The Science a) Focus.. b) Detention Reform c) Focus on Reducing Racial Disparities d) Risk Assessment Instruments. e) Detention Services f) Judicial Support g) Community Champion h) Data.... i) Minority Community Involvement/Leadership j) Outcome Indicators
CWLA: Multiple Intervention Strategies • Research • Integration and Collaboration • Advocacy
Lessons Learned • Advocates should intentionally focus on racial and ethnic disparities. • Solid research and relevant data are powerful tools for reform. • There are many ways to address racial and ethnic disparities. • There are many types of advocates. • Effective reform usually requires multiple strategies. • Media advocacy can level the playing field. • There are many ways to define success. • There is a long way to go.
A Strength-Based Culturally Competent Approach to Reducing Disproportionate Minority Contact
Pillars, Paradigms and Philosophies • Identifying/owning that problems exist • Working hard on a strategy that is: • Cultural Competence • Strength Based (identifying and using assets) • Solution Focused- Change Focused • Community-based Collaborative efforts • Data driven activities • Evaluating results
“It is clear from the research that race plays a critical role at various decision points in the juvenile justice system. Family characteristics, socioeconomic status, education, and other socio-structural factors such as societal stereotyping further complicate the overrepresentation problem.” ~Anna McPhatter, PhD, 2002
Disparities between Girls and Boys • In 2001, “females accounted for 23% of juvenile arrests for aggravated assaults • 32% of juvenile arrests for other assaults” (Snyder, 2003). • arrest rates for girls between 1981 and 1997 rose 103% compared with a 27% increase for boys a greater number of delinquency cases for girls being referred to the court (68% increase) than for boys (40% increase).
Disparities between Girls and Boys • For girls, the disparate treatment of youth of color is also a significant factor in DMC. Approximately two-thirds of the girls in the juvenile justice system are of color, primarily African American and Latina
CWLA, 2005 • Recent research has found various statistical supports for the argument that youth of color are coming into contact with the juvenile justice system much more frequently than white youth.
The juvenile arrest rate for all offenses reached its highest level in the last two decades in 1996, and then declined 29% by 2002. Juvenile Arrest Rates for All Crimes, 1980-2002
Figure 3 AFRICAN AMERICAN JUVENILES ARE ARRESTED IN NUMBERS OUT OF PROPORTION TO THEIR REPRESENTATION IN THE GENERAL POPULATION 100% 80% 60% 40% 20% 0% Youth under age 18 Youth arrested 79 71 PERCENTAGE OF POPULATION ARRESTED 26 15 African American White RACE Source: Yamagata, Eileen Poe and Michael A. Jones. And Justice for Some: Differential Treatment of Minority Youth in the Justice System. Washington, DC: Building Blocks for Youth, April 2000.
Figure 5 AFRICAN AMERICAN YOUTH ARE ARRESTED AT TWICE THE RATE OF WHITE YOUTH 7,000 6,000 5,000 4,000 3,000 2,000 1,000 0 6,000 ARREST RATE (youth arrested per 100,000 in general population 3,000 African American White RACE Source: Yamagata, Eileen Poe and Michael A. Jones. And Justice for Some: Differential Treatment of Minority Youth in the Justice System. Washington, DC: Building Blocks for Youth, April 2000. U.S. Population Estimates by Age, Sex, Race, and Hispanic Origin: 1980-1999. Population Estimates Program, Population Divisions, U.S. Census Bureau, 2000.
Figure 6 WHITE YOUTH REPORT COMMITTING HIGHER LEVELS OF WEAPONS POSSESSION CRIMES, YET AFRICAN AMERICAN YOUTH ARE ARRESTED 2.5 TIMES THE RATE OF WHITES FOR WEAPONS OFFENSES WEAPONS POSSESSION CRIMES WEAPONS POSSESSION ARREST RATES 12% 10% 8% 6% 4% 2% 0% 3.0 2.5 2.0 1.5 1.0 .5 0 10 8 SELF-REPORTED CRIME RATE (in percentage) RATE PER 100,000 1.3 O.5 White African American White African American RACE RACE Source: Yamagata, Eileen Poe and Michael A. Jones. And Justice for Some: Differential Treatment of Minority Youth in the Justice System. Washington, DC: Building Blocks for Youth, April 2000. U.S. Population Estimates by Age, Sex, Race, and Hispanic Origin: 1980-1999. Population Estimates Program, Population Divisions, U.S. Census Bureau, 2000; Snyder, H. and M. Sickmund. Juvenile Offenders and Victims: 1999 National Report. Office of Juvenile Justice and Delinquency Prevention, U.S. Department of Justice, 1999.
Figure 7 WHITE YOUTH REPORT USING DRUGS AT 6 TO 7 TIMES THE RATE OF AFRICAN AMERICANS, BUT AFRICAN AMERICAN YOUTH ARE ARRESTED AT HIGHER RATES THAN WHITES FOR DRUG CRIMES 8.0% 7.0% 6.0% 5.0% 4.0% 3.0% 2.0% 1.0% 0.0% 8.0 7.0 6.0 5.0 4.0 3.0 2.0 1.0 0.0 12th graders Reported using cocaine 12th graders reported using crack 7.0 6.1 SELF-REPORTED CRIME RATE ARREST RATE FOR DRUG OFFENSES (per 100,000 in general population) 3.0 2.4 1.0 .5 African American African American White White RACE RACE Source: Yamagata, Eileen Poe and Michael A. Jones. And Justice for Some: Differential Treatment of Minority Youth in the Justice System. Washington, DC: Building Blocks for Youth, April 2000. U.S. Population Estimates by Age, Sex, Race, and Hispanic Origin: 1980-1999. Population Estimates Program, Population Divisions, U.S. Census Bureau, 2000; Monitoring the Future Report, 1975-1999, Volume I, Washington, DC: National Institute on Drug Abuse, 2000.
Figure 8 AFRICAN AMERICAN YOUTH ARE OVERREPRESENTED IN DRUG ARRESTS BUT UNDERREPRESENTED IN DRUG TREATMENT 100% 90% 80% 70% 60% 50% 40% 30% 20% 10% 0% Youth population Youth arrested for drug offenses Youth in treatment facilities 79 68 66 PERCENTAGE OF YOUTH 32 17 15 African American White RACE Source: Yamagata, Eileen Poe and Michael A. Jones. And Justice for Some: Differential Treatment of Minority Youth in the Justice System. Washington, DC: Building Blocks for Youth, April 2000. Treatment Episode Data Set (TEDS) 1998. Office of Applied Studies, Department of Health and Human Services, Substance Abuse and Mental Health Services Administration.
Figure 9 AFRICAN AMERICAN YOUTH ARESTED FOR DRUG OFFENSES ARE A THIRD LESS LIKELY TO BE DIVERTED TO DRUG TREATMENT FACILITIES 35% 30% 25% 20% 15% 10% 5% 0% 29 18 PERCENTAGE OF YOUTH ARRRESTED ON DRUG CHARGES DIVERTED BY THE COURT TO TREATMENT FACILITIES African American White RACE Source: Yamagata, Eileen Poe and Michael A. Jones. And Justice for Some: Differential Treatment of Minority Youth in the Justice System. Washington, DC: Building Blocks for Youth, April 2000. U.S. Population Estimates by Age, Sex, Race, and Hispanic Origin: 1980-1999. Population Estimates Program, Population Divisions, U.S. Census Bureau, 2000: Treatment Episode Data Set (TEDS), 1998. Office of Applied Studies, Department of Health and Human Services, Substance Abuse and Mental Health Services Administration.
Minority Children Are at Risk Living in America Infant mortality rate ( per 1,000) White Black 1964 21.6 42.3 2001 5.7 14.0 Children in Poverty( percent) 1965 14.4 93.8 2002 13.1 31.3 Children Defense Fund, 2004
Minority Children Are at Risk Living in America School Enrollment at age 16-17 (percent) White Black 1964 88.3 82.4 2002 92.8 91.4 High School dropouts 16-24 1967 15.4 28.6 2000 6.9 13.1 Children’s Defense Fund, 2004
Minority Children Are at Risk Living in America Teen Birth Rate White Black 1964 63.2 143.4 2002 39.4 66.6
Figure 4 SOCIAL AND ECONOMIC INDICATOR BY RACE5 White African Asian and Social Indicator American Pacific Islander Hispanic Youth arrests—1998 71% 26% 1% Not available Youth arrest rates: per 100,000 youth—19986 320 620 200 Not available Children living below the Poverty line—20007 13.5% 33.1% 11.8% 30.3% Families living below the Poverty line—20008 5.7% 22.7% 9.6% 21.7% Female-headed household Below the poverty line--20009 19.8% 41.0% 23.0% 40.7% High school graduates—199710 87.7% 77.6% 85.3% 57% Homicides per 100,000 Residents—199711 3.9 26.6 4.6 (1996) 12.4 (1996) Adults under correctional Supervision 199712 2.0% 9% Not available Not available Unemployment rates of persons Age 16 and older--199713 4% 9% Not available 8% Infant mortality rates per 100,000 residents—199514 8 14 5 6
Minority Children are Disproportionately Represented in Other Areas Misidentification in Special Education • In 29 States Black students <2x as likely a white to be labeled with emotional and behavioral disorders • In 39 states Black students <2x as likely to be labeled as mentally retarded • In 10 states Native American children are 2x as likely to be labeled mentally retarded than White children • Children Defense Fund, 2004
Once labeled as disabled; • Black and Latino children are significantly less likely than white to receive special education services as mainstreamed students in an inclusive classroom • Black, Latino, and Native American children youths with disabilities were 67% more likely than whites youths to be removed on grounds of dangerousness by a hearing officer
Employment : ages 16-19 (% of pop.) all races Black Latino Jobless 6/1995 49.2 72.6 60.0 6/2004 59.8 77.5 68.6 Employment 6/1995 50.8 27.4 40.0 6/2004 40.2 22.5 31.4 (Bureau of Labor Statistics)
Child Welfare SystemRacial Disproportionality in the US Child Welfare Systems, Anne E. Casey Foundation, 2002
*Living in Low Income Families*National Center for Children in Poverty. 8/2003
Exercise #2 Pick a Starting Point • Discuss in with your group the challenges faced by minority youth in the various systems just presented. • Decide as a group, which decision point, service, issue, practice or law you’d like to start an initiative to address. • Be prepared to share with the larger group, why your group chose this starting place.
CULTURAL COMPETENCE A set of congruent behaviors, attitudes and policies that come together in a system, agency, or professional and enable that system, agency or professional to work effectively in cross-cultural situations. (Cross, 1988)
Defining Culturally Competence Practice Culture: The integrated pattern of human behavior that includes thought, speech, action, the customary beliefs, social forms and material traits of a racial, religious or social group. Competence: The state of being; the ability or capacity to function effectively. Culturally Competent Practice • The state of being capable of functioning effectively in the context of cultural differences; • Having multi cultural counseling skills • Meeting the culturally unique needs of clients.
Motivationto Be Culturally Competent: The Five C’s • Correct • Compliance • Compelled • Competent • Competition
Cultural Competent Practice Beliefs • Families are diverse and have the right to be respected for their special ethnic, cultural, religious and other traditions • Practice and services are delivered in a manner that strengthens the family’s identity • Child-rearing patterns are influenced by cultural norms and mores • Every culture has positive attributes as well as challenges
The Tripartite PersonKluckhon & Murray 1956 Universal Culture Individual or unique
Social Ecology: Non-Group Specific Economic Conditions System of Government Geographic Region Societal Norms Institutional Values of Origin History of Group in Current Country Personal Ecology Family Worldview School Job Age Peer group Range of experience *Culture and Counseling Social and Personal Ecology Variables Counselor Variables Culture same as Client General Counseling Competency Multicultural Counseling Competency Social Ecology: Group Specific Race Ethnicity Class Religion Culture of Origin Gender Sexual Preference * Dr. H.C.Coleman, 1999 ,U. of WI
Multicultural Counseling requires the recognition of: • the importance of racial/ethnic group membership on the socialization of the client; • the importance of the uniqueness of the individual; • the presence of culture and the role it has in client’s life • the place of value culture has in the counseling process; and • the uniqueness of learning styles, vocational goals, and life purposes of clients, within the context of principles of democratic social justice (Locke, 1986).