Download
1 / 43
430 likes | 768 Views
Minimizing Feed Costs for Improved Profitability. Joel DeRouchey, PhD, Mike Tokach, PhD, Steve Dritz, DVM, PhD, Bob Goodband, PhD, and Jim Nelssen, PhD. K - S TATE R ESEARCH and E XTENSION. Feed Efficiency. High feed disappearance. Low ADG. Other factors. F/G = Total feed delivered

E N D
Minimizing Feed Costs for Improved Profitability Joel DeRouchey, PhD, Mike Tokach, PhD, Steve Dritz, DVM, PhD, Bob Goodband, PhD, and Jim Nelssen, PhD K-STATERESEARCH andEXTENSION
Feed Efficiency High feed disappearance Low ADG Other factors • F/G = Total feed delivered • Weight out – Weight in
Feed Efficiency High feed disappearance
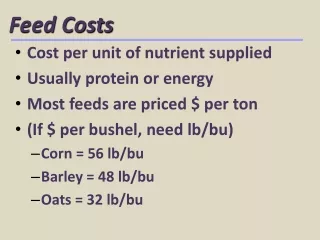
What to do with high corn and soybean meal prices? • Dietary ingredients • Evaluating alternatives • Added Fat • Synthetic amino acids • DDGS • Glycerol • Whey • Work with what you have: Improve F/G • Feed budgets and phase feeding • Particle size evaluation • Feeder management • Genetics • Watch market weights
Alternative Feed Ingredients Cost Processing Storage Quality Control Agronomics Animal Performance
Alternative Ingredient Sources • Partial Replacements • Distillers grains • Most common but regional • Fats / Oils • 2.25 times energy as corn • Use has dramatically reduced due to cost • AV blends vs. only vegetable or choice white grease
Alternative Ingredient Sources • Wheat midds • Bulk density • Low energy - Monogastrics • Bakery products • Variability and availability • Meat and bone meal • Variability of product • 5 – 10% of the diet • Grain screenings • Variability and potential mycotoxins • Off quality grains • Low test weight
Determining the economics of adding fat to a grain-soybean meal diet • Increased cost of the diet • F/G improvement with fat • 2% improvement for every 1% fat • ADG improvement with fat • 1% improvement for every 1% fat (average) • 2% improvement in early grower • No improvement in late finisher
Increasing dietary energy density with added fat: Analysis of field experiments • 9 in field research facilities (total of 9,899 pigs) • Analyzed for the percent change in ADG and F/G per % added dietary fat (using Proc Mixed in SAS) • Model included: • Pig body weight • Feed intake as a percentage of body weight • Fat level • Disclaimers: • Field data from 2 systems • PIC 327 or 337 sires
Added Fat Summary • Remember that energy level drives ADG with high lean pigs in field conditions! • Should I have fat in my diets currently? • Long on space = No • Gain improvements not required while increasing feed cost • Short on space = Yes • Evaluate net return and determine optimum level of fat by dietary phase. • 2.5% for entire finishing = 3.2 lbs heavier pig • 5.0% for entire finishing = 6.1 lbs heavier pig
Using added fat for dust control • A common practice to reduce dust in the barns is to use 1% added fat • Current feed cost increase for dust control in finishing is $1.13 / pig from 50 to 250 lbs. • Current feed cost increase for dust control in finishing is $0.75 / pig from 120 to 250 lbs. • Simply cannot afford dust control in finishing diets
Evaluating diet cost with low protein amino acid fortified diets Calculator available at www.KsuSwine.org
DDGS - Growth Performance and Carcass Characteristics • Research is inconsistent when feeding DDGS on grow-finish pig performance. • Several studies have demonstrated decreased growth performance levels above 10% • Other studies suggest feeding DDGS at levels up to 30% have no negative effect on growth performance • However - negative results on carcass yield and fat quality are clearly demonstrated
Effect of DDGS withdrawal time on dressing percent JBS United, 2007
DDGS - Summary • Currently, feeding up to 20% DDGS is the generally the most economical in grow-finish diets in most situations • These levels may or may not decrease performance • How to handle yield impacts – withdraw or ignore • Feeding 20% DDGS should not by itself increase carcass IV values over 73 • However, feeding this level along with an unsaturated fat source more then likely will
Gylcerol for swine diets • Gylcerol is the resulting product of the bio-diesel industry • Pure glycerol is a colorless, odorless, and a sweet-tasting viscous liquid (when fresh) • Much less is known about its use in livestock feeding • Currently numerous National Pork Board and state pork association funded experiments underway • Fall 2007 price = ~ $0.06 / lb • Current price = ~ $0.12 – 0.15 / lb
Effects of glycerol and soy oil on growth performance of growing pigs(25 to 55 lb) Soy oil, quadratic P < 0.07, glycerol and blend linear P < 0.06 Soy Oil, % Soy/glycerol blend, % Groesbeck et al., 2008
Effects of glycerol and DDGS on growth performance of finishing pigs(70 to 217 lb) Duttlinger et al., 2008
Effects of glycerol and fat on growth performance of finishing pigs(170 to 220 lb) Duttlinger et al., 2008
Glycerol after 3 months in refrigerator Fresh Glycerol on arrival
Dried Whey for 15 to 25 lb pigs • In recent trials at K-State with 15 to 25 lb pigs, removing the 10% dried whey from the diet lowered pig weight by 0.5 to 1 lb/pig (Bergstrom et al., 2007). • The savings achieved by lowering feed cost was greater than the value of weight that was lost by using the more simple diet without a lactose source. • Typically, dried whey must be priced at approximately $0.35 per lb to breakeven when comparing feed cost and gain.
Dried Whey for 15 to 25 lb pigs • Obviously, if a more economical lactose source could be found or the diets reformulated with another strategy to achieve the higher final weight without the increased feed cost, it would be beneficial. • If a lactose alternative is not found; however, the most economic recommendation would be to feed the simpler diets and accept the lower ADG resulting from the decision. • Less drastic compromise • Divide into 2 phases with the first diet containing lactose source while the second diet does not. • Still maintain fishmeal and/or blood meal in both diets • No pig over 25 lb should ever receive lactose in the diet
Feed Budgets and Phase Feeding • Follow budgets carefully • Over budgeting simply increases cost due to overfeeding nutrients • Under budgeting can limit growth by causing pigs to be deficient in nutrients. • Additional diet phases can reduce feed costs
Do we still recommend split sex feeding? • Can you fill a room/barn (feed line) with less than 7 days of age spread of one sex? • If answer is no, you should minimize age spread rather than housing by sex. • If split sex feeding, same diets can be used for both sexes with different feed budgets to account for higher F/G of barrows
Effect of Particle Size on Nutrient Digestibility Particle Size Digestibility, % Microns DM CP Energy F/G < 700 86.1 82.9 85.8 1.74 700-1000 84.9 80.5 84.4 1.84 > 1000 83.7 79.1 82.6 1.92 KSU, 1985 Based on pig performance and grinding considerations, we recommend a particle size of 700 microns with a range of 600 to 750 microns
Particle size – Economics • 1.2% change in F/G equals - • ~ 7 lbs of feed per finishing pig • $0.68 change in current per pig feed cost • Measure weekly on farm, monthly with lab
Accuracy of the One-Sieve Method 41% of Samples are within ± 100 microns Baldridge et al. 2001
Accuracy of the Three-Sieve Method Procedures for three-sieve method available at www.KsuSwine.org 95% of Samples are within ± 100 microns Baldridge et al. 2001
Effects of Decreasing Particle Size (700 microns) • Increases particle surface area • Allows for greater interaction with digestive enzymes • Increased nutrient digestibility and decreased nutrient excretion • Improved feed efficiency
Disadvantages of Grinding Too Fine ( < 600 microns) • Increased dustiness • Increases electrical costs • Increased time • Decreased feed flowability • Increased gastric ulcers
Basics: Adjust the feeders frequently Picture available at www.KsuSwine.org
“If your fingers don’t hurt, you’re not adjusting feeders enough.” K-STATE Proper Feeder Adjustment
www.KsuSwine.org Joel DeRouchey, PhD, Mike Tokach, PhD, Steve Dritz, DVM, PhD, Bob Goodband, PhD, and Jim Nelssen, PhD