Download
1 / 1
10 likes | 32 Views
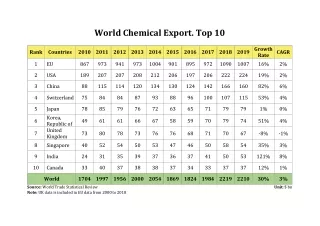
Do you want to know about the world's top 10 chemical-exporting countries? here is the accurate data about the growth rate of the countries from 2010 to 2019

E N D
World Chemical Export. Top 10 2010 2011 2012 2013 2014 2015 2016 2017 2018 2019 Growth Rank Countries CAGR Rate 16% 1 EU 867 973 941 973 1004 901 895 972 1090 1007 2% 2 USA 189 207 207 208 212 206 197 206 222 224 19% 2% 3 China 88 115 114 120 134 130 124 142 166 160 82% 6% 4 Switzerland 75 84 84 87 93 88 96 100 107 115 53% 4% 5 Japan Korea, Republic of United Kingdom Singapore 78 85 79 76 72 63 65 71 79 79 1% 0% 6 49 61 61 66 67 58 59 70 79 74 51% 4% 7 73 80 78 73 76 76 68 71 70 67 -8% -1% 8 40 52 54 50 53 47 46 50 58 54 35% 3% 9 India 24 31 35 39 37 36 37 41 50 53 121% 8% 10 Canada 33 40 37 38 38 37 34 33 37 37 12% 1% World 1704 1997 1956 2000 2054 1869 1824 1984 2219 2210 30% 3% Source: World Trade Statistical Review Note: UK data is included in EU data from 2000 to 2018 Unit: $ bn