Download
1 / 2
20 likes | 33 Views
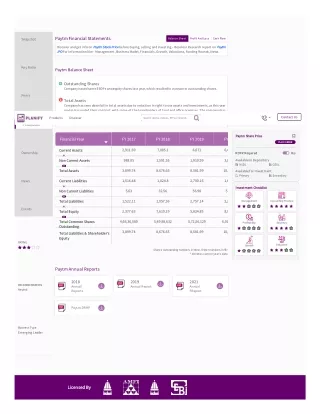
Get info on Paytm Profit and Loss, assets, liabilities, shareholders etc. Check out for valuable insights on Paytm Annual Reports.

E N D
Paytm Financial Statements Balance Sheet Profit And Loss Cash Flow Snapshot Discover and get info on Paytm Stock Price before buying, selling and investing - Read our Research report on Paytm IPO For Information like - Management, Business Model, Financials, Growth, Valuations, Funding Rounds, News. Key Ratio Paytm Balance Sheet Outstanding Shares Company issued some ESOPs and equity shares last year, which resulted in increase in outstanding shares. Peers Total Assets Company has seen downfall in total assets due to reduction in right to use assets and investments, as this year paytm has ended their contract with some of the leaseholders of land and o?ice premises. The company has also reduced its investments in fixed deposits, though in last 4 years total assets of the company has grown at CAGR of 23.76% Contact Us Products Discover Search stocks, indices, ETFs or brands Financials Paytm Share Price Financial Year FY 2017 FY 2018 FY 2019 FY PLACE ORDER 2,911.69 7,085.1 6,671 6,4 Current Assets Ownership ROFR Required Yes 988.05 1,591.55 1,910.99 3,8 Available in Depository NSDL Non Current Assets CDSL 3,899.74 8,676.65 8,581.99 10, Total Assets Available for Investment Primary Secondary 1,516.48 1,024.8 2,700.16 1,6 Current Liabilities News Investment Checklist 5.63 32.56 56.98 5 Non Current Liablities 1,522.11 1,057.36 2,757.14 2,2 Total Liabilities Management Accounting Practice Events 2,377.63 7,619.29 5,824.85 8,0 Total Equity 4,66,36,580 5,49,98,632 5,72,56,129 6,01 Total Common Shares Outstanding Profitability Solvency 3,899.74 8,676.65 8,581.99 10, Total Liabilities & Shareholder's Equity RATING Valuation Growth Shares outstanding numbers in None. Other numbers in ₹ Cr * denotes current year's data Paytm Annual Reports 2018 Annual Reports 2019 Annual Report 2021 Annual FReport RECOMMENDATION Neutral Paytm DRHP Business Type Emerging Leader Licensed By
Team About Us Sitemap Channel Partner Contact Us Pre-IPO Careers Planify Consultancy India Pvt. Ltd Planify Capital India Pvt. Ltd SEBI Registration - NSE:AP2815021843(CM Segment), AP2815021843(FO Segment), MCX:AP144517 Mutual Fund License No. ARN-164419 , IRDA Code: ABLIC1003123454, ABLIC1003131639 91 Springboard, NH8-Udyog Vihar, 90B Sector 18, Gurugram, Haryana 122008 Copyright © 2019 Planify.in. All Rights Reserved Privacy Policy | Cancellation & Refund | Terms & Conditions Powered by Inwoin