Download
1 / 2
20 likes | 32 Views
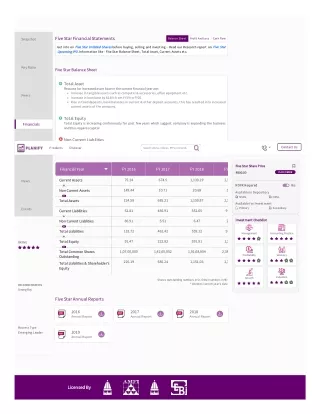
Get info on Five Star Profit and Loss, assets, liabilities, shareholders etc. Check out for valuable insights on Five Star Annual Report.

E N D
Five Star Financial Statements Balance Sheet Profit And Loss Cash Flow Snapshot Get info on Five Star Unlisted Shares before buying, selling and investing - Read our Research report on Five Star Upcoming IPO. Information like - Five Star Balance Sheet, Total Asset, Current Assets etc. Key Ratio Five Star Balance Sheet Total Asset Reasons for increased asset base in the current financial year are: Increase in tangible assets such as computer & accessories, o?ice equipment etc. Increase in loan base by 82.8% from FY19 to FY20. Rise in fixed deposits, bank balances in current & other deposit accounts, this has resulted into increased current assets of the company. Peers Total Equity Total Equity is increasing continuously for past few years which suggest company is expanding the business and thus requires capital Financials Non Current Liabilities Company's non current liabilities has decreased down for the past few years, which suggest company has enough finance to grow and generate profit. Contact Us Products Discover Search stocks, indices, ETFs or brands Ownership Five Star Share Price Financial Year FY 2016 FY 2017 FY 2018 FY ₹800.00 PLACE ORDER 75.14 674.5 1,130.19 2,3 Current Assets News ROFR Required Yes 149.44 10.71 20.68 3 Non Current Assets Available in Depository NSDL CDSL 224.58 685.21 1,150.87 2,3 Total Assets Available for Investment Primary Secondary Events 52.81 456.91 552.65 9 Current Liabilities Investment Checklist 80.91 5.51 6.47 2 Non Current Liablities 133.72 462.42 559.12 9 Total Liabilities Management Accounting Practice 91.47 222.82 591.91 1,3 Total Equity RATING 1,07,00,000 1,42,65,052 1,91,68,854 2,38 Total Common Shares Outstanding Profitability Solvency 225.19 685.24 1,151.03 2,3 Total Liabilities & Shareholder's Equity Valuation Growth Shares outstanding numbers in Cr. Other numbers in ₹ Cr * denotes current year's data RECOMMENDATION Strong Buy Five Star Annual Reports 2016 Annual Report 2017 Annual Report 2018 Annual Report Business Type Emerging Leader 2019 Annual Report Licensed By
Team About Us Sitemap Channel Partner Contact Us Pre-IPO Careers Planify Consultancy India Pvt. Ltd Planify Capital India Pvt. Ltd SEBI Registration - NSE:AP2815021843(CM Segment), AP2815021843(FO Segment), MCX:AP144517 Mutual Fund License No. ARN-164419 , IRDA Code: ABLIC1003123454, ABLIC1003131639 91 Springboard, NH8-Udyog Vihar, 90B Sector 18, Gurugram, Haryana 122008 Copyright © 2019 Planify.in. All Rights Reserved Privacy Policy | Cancellation & Refund | Terms & Conditions Powered by Inwoin