Trading Chart Patterns
Chart patterns are graphical tools to show the visual representation of the asset price over a period.<br><br>A chart can be defined as a collection of bars, columns, or candles that denote the rise or fall in the asset price.<br><br>The historical price of an asset plays a crucial role in predicting the future movement in chart pattern trading. Therefore, charts can be used to get a comprehensive overview of assetu2019s price over a period.


Trading Chart Patterns
E N D
Presentation Transcript
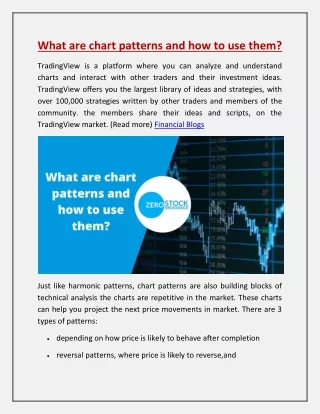
Top 10 Trading Chart Patterns Chart patterns are graphical tools to visually represent the asset price movement over time. Learn about top trading chart patterns & what they indicate. What are Chart Patterns? Chart patterns are graphical tools to show the visual representation of the asset price over a period. A chart can be defined as a collection of bars, columns, or candles that denote the rise or fall in the asset price. The historical price of an asset plays a crucial role in predicting the future movement in chart pattern trading. Therefore, charts can be used to get a comprehensive overview of asset’s price over a period. Trading Charts provide traders with critical information, including the opening, closing, high and low prices, the overall trend, potential reversal and continuation, etc. These instruments are helpful in finding potential opportunities in the forex, cryptocurrencies, stocks, indices, and commodity markets.
Top Trading Chart patterns for beginners The price movement of an asset is shown in a chart with the help of candles or bars. These candles usually form different patterns or structures on the chart. Each pattern or structure provides traders with helpful insight into the future price trend. Therefore, knowledge of these trading charts and what they interpret is a must. Let us discuss the top formations to help you take your chart pattern trading journey to the next level: Bull Flag and Bullish Patterns The bull flag is a continuation pattern indicating an upward breakout’s possibility. Usually, it develops following a significant price surge and then a brief period of consolidation resembling a downward-sloping rectangle. Many times, traders look for a breakout above the flag to validate the bullish trend. Head and shoulders
Head and shoulders are amongst the most successful chart patterns for trading. The pattern looks exactly similar to the structure of the head and shoulders. Bearish Head and Shoulder The pattern has three peaks, where the middle peak (Head) is the highest, and the other two (shoulders) are of the same height. The pattern indicates a shift in the trend from bullish to bearish. Under this, when the price breaks, the support, it is expected to fall further. It suggests traders open a short position or close a buy position inverted. Bullish Head and Shoulder It makes an inverted head and shoulder-like structure. The pattern has three lower peaks; the middle peak is the lowest, and the other two are the same height. The pattern indicates a shift in the trend from bearish to bullish when the price breaks the resistance. Inverse Head and Shoulders Pattern A classic reversal pattern, the inverse head and shoulders shows a move from a down trend to an uptrend. There are three troughs total; the main one the head is the lowest and the two side troughs shoulders are higher. A breakthrough above the neckline verifies the reversal.
RSI Divergence RSI divergence is a prominent signal for probable reversals. When the price makes new highs or lows, but the Relative Strength Index (RSI) swings in the other direction, it hints about a weakening trend and a likely reversal. Double top A double-top pattern is an M-like structure that consists of two peaks with the same heights. It is a bearish pattern where, if the price breaks the low point or support, it is expected to fall further. The double top patterns form during an upward trend where bulls have tried to take the price to new highs; however, bears have managed to reverse the over trend. Hence, it signals traders to open short positions. Double bottom A double bottom is a bullish reversal pattern that looks exactly the opposite of double tops and forms a W-like structure. It occurs during a downtrend, forming two bottoms of the same heights and one peak in the middle.
When the price breaks the resistance level or neckline, it is expected to rise further, suggesting a trend reversal from bearish to bullish. Hence, it signals traders to open a long position. Ascending Triangle An ascending triangle is among the popular trading chart patterns for beginners. It comprises two lines: one horizontal line of resistance that connects the highs and another line of the uptrend that connects the higher lows. These two lines form a triangle-like structure with a flat resistance line and strong uptrend lines. When the price breaks the resistance line, it suggests the continuation of a bullish trend. When the price breaks the support line, it suggests a continuation of the downtrend. It also provides traders with valuable information, including entry points, stop loss, and take profit level.
Descending Triangle As the name suggests, the descending triangle looks exactly the opposite of the ascending triangle. It forms one horizontal flat line of support that connects the lows and another line of downtrend that connects the lower highs. When the price breaks the support, it suggests that it will fall further and signals traders to open a short position and vice versa.
Wedges Wedges are also amongst the popular trading chart patterns to spot trend continuations. The pattern is quite similar to pennants or flags. However, it is made up of two trend lines moving in the same direction and tightening towards each other. Wedges are of two types: Rising and falling. A rising wedge pattern consists of two trend lines moving in an upward direction. It indicates the start of a downtrend when the price breaks the support level. It suggests traders open a sell position or close a buy position. Meanwhile, a falling wedge pattern consists of two trend lines moving in a downward direction. After it occurs, the price is expected to break the resistance level. It signals traders to open a long position.
Pennants A Pennant looks quite similar to wedge patterns; it contains two trend lines, one upward and one downward. It is a continuation pattern and can be either bullish or bearish. When the pennant forms, the volume tends to decrease, and after the completion, a breakout is expected to occur in the direction of the previous trend. In a bearish pennant, a breakout below the trendline indicates traders open a short position, while in a bullish pennant, a breakout above the trendline indicates traders open a long position. Symmetrical Triangle
A symmetrical triangle is amongst the most popular chart patterns for day trading. It forms when two trend lines approach each other. One trendline connects the lower peaks, while one trendline connects the higher troughs. A symmetrical pattern occurs when there is not a clear direction of trends or during indecision in the market. However, it can be seen as a continuation trend; a breakout above the trendline signals the trader to open a long position, while a breakout below the trendline signals the trader to open a short position. Rounding Top and Bottom A round top or bottom is a semicircle type of charting pattern. A round bottom looks similar to U shape, while a round top looks like an inverted U.
Round top form is when the price rises, reaches a peak, and then declines. It indicates that bulls lose their control, and bears manage to reverse the trend.
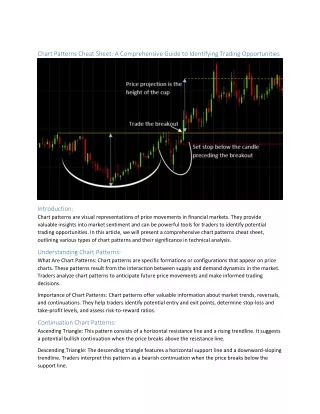
Meanwhile, the Round bottom is a bullish reversal pattern. The price first falls and then rises and forms a U-like structure. The pattern suggests traders open a long position when the prices are in the middle. Cup and Handle Pattern The cup and handle is a bullish reversal charting pattern. Under this, the cup looks exactly similar to the round bottom pattern, followed by a handle-like shape that shows consolidation. The price first makes a U-like structure and then starts moving downwards in a consolidated range within two trendlines. The pattern completes when the price touches the resistance trend line. The pattern indicates the start of a strong uptrend and signals traders to open a long position. Chart Patterns Cheat Sheet ● Shooting Star Candlestick: A bearish reversal pattern that emerges after an uptrend, typified by a short body and a long upper wick. ● Hanging Man: A negative indicator coming at the end of an upswing, with a small body and a long lower wick. ● Inverted Hammer Candlestick: A probable bullish reversal indicator found at the bottom of downtrends, with a short body and a long upper wick. ● Morning Star Candlestick: A three-candle bullish reversal pattern, signifying the end of a downturn.
● Evening Star Pattern: A three-candle bearish reversal pattern that heralds the conclusion of an uptrend. ● Hammer Candlestick: A bullish reversal indicator, generally encountered at the bottom of a downtrend, having a small body and a lengthy lower wick. Bottom Line Chart Patterns are valuable technical analysis tools to understand and interpret the asset price movement. Trading chart patterns let you make a whopping amount of money in the financial market. However, one thing you should consider while trading charts is every touch or every breakout is not an indication to trade. Sometimes, these tools may generate false and misleading signals, so always seek confirmation. In addition, purely making trade decisions based on these tools is not a good idea. So, combine these technical tools with current market conditions and make trade decisions accordingly. FAQ 1. What is the best chart pattern to trade? Research suggests that some of the most reliable and successful chart patterns are the Head & Shoulders, with an 89% success rate, the Double Bottom (88%), and the Triple Bottom and Descending Triangle (87%). The most profitable chart pattern is the Rectangle Top, with a 51% average profit. 2. Do chart patterns work in trading? A research by Michael Kahn found that chart patterns exhibit a degree of accuracy in predicting price reversals, assigning an 89% success rate to the head and shoulder pattern. 3. Why do chart patterns fail? when the price does not confirm the expected breakout or reversal, or when the price moves beyond the pattern boundaries without a clear direction. For example, a head and shoulders pattern can fail when the price does not break below the neckline, or when it breaks above the right shoulder. 4. What is the most successful day trading pattern? There isn’t a one “most effective” pattern; effectiveness relies on market conditions and the trader’s plan. Patterns like the head and shoulders or double tops are popular due to their reliability.