Download

1 / 22

E N D
Science section of the economy as a whole, the problems of economic growth and employment, opportunities and work of the economic mechanism of the functions of the state and economic policy called macroeconomics. • The objective is to analyze the interaction of macro economic operators and individual markets. • Under the national economy is considered to be the country's economy. This is a collection of all sectors and regions, connected in a single organism multilateral economic ties.
A summary of the economic development of the state is reflected in the national accounts • National Accounts - a collection of various macroeconomic indicators.
There are many kinds of indicators of economic well-being of society. The primary measure in the preparation of the SNA is the gross national product, or - briefly - GNP. • Gross national product (GNP) - is the total market value of the total final output of goods and services in the economy for the year. • Gross domestic product (GDP) - is monetary value of all final goods produced and services in the economy for the year in that country. • Net National Product (NNP) is the gross national product, net of depreciation. • GDP = NNP – D (net of depreciation)
National Income (NI) - is a newly established annual cost, which has added production in a given year to the welfare of society. With his calculation does not include the amount of depreciation, indirect taxes and government subsidies. LP - a "Wages income" society (wages, income, profits). • NI = NNP – Te (indirect taxes) • Personal income (PI) is the total income received by the owners of economic resources. • PI = NI - contributions to system of social insurance - corporation profit taxes - retained earnings of corporation + transfer payments • Disposable income (DI) - the income, which is in the personal possession. It is smaller than the personal income tax on the value of the individual, who must pay the owners of economic resources in the form of the (primarily income) taxes. • Yd = PI – individual taxes
THE CALCULATION OF GNP EXPENDITURE • GNP = C + I + G + Xn , • where: • C - personal consumption expenditures of households on durable consumer goods, goods for current consumption, and consumer spending on services. • I – gross private domestic investment, or "investment spending." They include three components: 1) the purchase of entrepreneurs machinery, equipment and tools, 2) all construction (commercial and residential construction), 3) investments in stocks. • G - government procurement, which include public consumption and public investment. • X – net exports. It represents the difference between income from exports and expenditure on imports of the country and meets the trade balance.
CALCULATING GNP BY REVENUE IN THIS CASE, GDP IS CONSIDERED AS THE SUM OF REVENUEOF OWNERS OF RESOURCES, I.E. AS THE SUM OF FACTOR INCOME GROSS DOMESTIC PRODUCT = (C+S) + I + R + Π + D
THE CALCULATION OF GNP "VALUE ADDED" • With this method, the calculation of GNP must sum of value added by all sectors and industries in the economy. An objective analysis of the economy is possible only with a stable (or comparable) price level. Analysis of the price level is necessary in order to: • - To know whether there have inflation or deflation, • - Reduced to a single base heterogeneous components of total production.
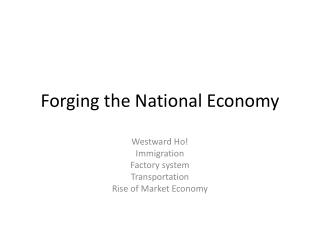
THE CIRCULAR FLOW – SIMPLE VERSION Factors of production GDP GDP Goods Factors of production Goods GDP GDP
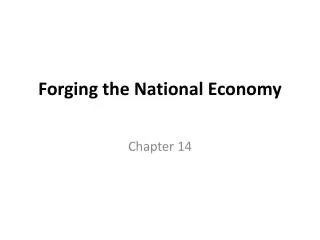
MODELING A FIRM • Before we look at the more detailed version of the circular flow, we will illustrade the model of the firm. • A firm in our model is a unit which adds value to products. These products may be raw material, semi-manufactured goods, final goods and services. By adding value, we mean that the firm acquires the good, adds value to it and then sells it. A supermarket adds value to a final good by making it more available to consumers and a bakery adds value to flour when it bakes bread. • From the diagram we see that the value added in a firm must be equal to the compensation to the factors of production. This must be the case since the net flow of money for a firm must be zero (remember that profits become return to capital – a compensation to the owners of the firm).
MODELING A FIRM Return to Capital Capital Payments for goods and services Goods and services FIRM Raw material, semi manufactured goods and services Payments for goods and services Return labor Labor
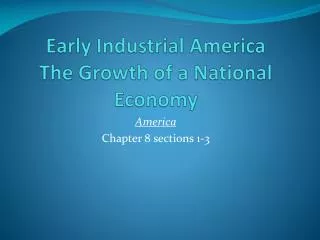
FIRMS IN THE CIRCULAR FLOW • We aivide all firms into three categories: FR consists of all firms that acquire raw material (iron ore, farm products and so on), FH all those that produce semi-manufactured goods (steel, pulp and so on) and FF all firms producing finished goods (software, cars and so on). We use the symbol Y for GDP. All of Y will go to the firms in the FF box. However, if we sum the value added from all firms, we will get exactly Y. • If YR is the total value of all goods going from FR to FH, then the total value added from all firms in the FR box is equal to YR (they do not purchase any goods to which they add value) • In the same way, if the total value of all goods going from FH to FF is given by YH, then the total value added from all firms in the FH box is YH – YR. • In the same way, the total value added for all firms in the FF box will be equal to Y – YH. If we sum all the value added from all firms, we get • YR +(YH – YR) + (Y – YH) = Y • The total return to the factor market = Sum of all value added = GDP
FIRMS IN THE CIRCULAR FLOW YR YH Raw material Semi-manufactured goods V.A.Yh - Yr V.A.: Yr Y Finished goods V.A.: Y - Yh
MONEY IN CIRCULAR FLOW Firms Finished goods and services Factors of production Factor of production Investment Private consumption Imports Exports Government spending Factors of production
CICULAR FLOW – CIRCULAR OF MONEY Firms Yr Yh I FR FH FF Y Y C Goods market Factor market G Y X Im Rest of the world Household Government NT Sg Sr Sh I Financial markets
EXAMPLE OF VALUE ADDED METHOD • Consider the case of a table that a retailer sells for 400$. If the retailer sells 10 tables, this amounts to 4000$ of output. However, before the retailer can sell the tables, other steps in the chain must occur. First, the retailer must purchase the tables from a manufacturer for say, 200$ per table. Second, the manufacturer has to purchase wood from a lumberyard at a cost, say, of 100$ per table. If we were to count every stage of the production process, then output might seem to be 7000$. That is: • 100$x10 + 200$x10 + 400$x10 = $7000 WRONG • $100x10 + (200-100)x10 + (400-200) x10 = $4000 CORRECT