Download

1 / 10
0 likes | 22 Views
Explore how Acoustic CFD Analysis improves valve performance. Unlock efficiency and optimize your systems with this groundbreaking approach.

E N D
Acoustic CFD Analysis in Valves Here is where your presentation begins
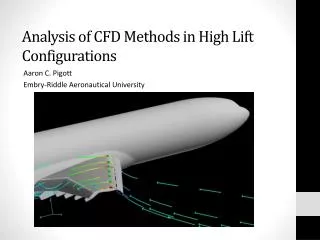
INTRODUCTION • Computational Fluid Dynamics (CFD) has emerged as a powerful tool in engineering simulations, allowing for a detailed analysis of fluid flow, pressure distribution, and temperature variations within a system. • Acoustic CFD analysis specifically focuses on understanding the generation, propagation, and interaction of sound waves within fluid-filled structures, such as valves.
The Goal of acoustic CFD analysis in valves is to gain insights into the intricate interactions between fluid flow and acoustic phenomena, enabling engineers to optimize valve designs, minimize noise pollution, and enhance overall performance. • This involves simulating the dynamic behavior of fluids and their interactions with valve structures to predict and mitigate potential acoustic challenges.
Why is Acoustic Modelling important? • Acoustic waves are pressure pulses travelling through a compression medium at the speed of sound in that medium. • Predicting valve acoustics is very tedious and costly for running experiments in laboratory in order to evaluate the effectiveness of one design over the other.
Predicting valve acoustics using CFD has become possible with advanced computational capabilities and different turbulent models such as RANS & LES to evaluate the pressure sound levels with reasonable accuracy. • Using CFD stands to the reason that if we could understand the turbulent time varying nature of pressure fields, we could calculate the noise generated in the valve trim with reasonable accuracy and that with just a fraction of cost and time in comparison to a physical laboratory experimentation and measurements.
Role of Noise trim and CFD analysis to predict Acoustic level • In a control valve where pressurized gas, steam or vapor is flowing contains enormous amount of potential energy. • This stored potential energy is converted into other forms such as turbulent fluid motion, heat, sound waves, vibration etc. • Majority of sound generated in a control valve is due to turbulent fluid motion. • Turbulence causes large pressure fluctuations due to the formation of eddies of all sizes.
The size of the eddy and fluid velocity determines the frequency of pressure fluctuation. Larger eddies produce lower frequency noise and vice versa. • For this reason Noise trims are used to reduce the aerodynamically generated noise by the fast moving fluid stream. This is done by increasing the pressure drop of the fluid in the trim. • This is done in Single and multi-stage noise trim by staging the pressure drop and bypassing the flow through many openings.
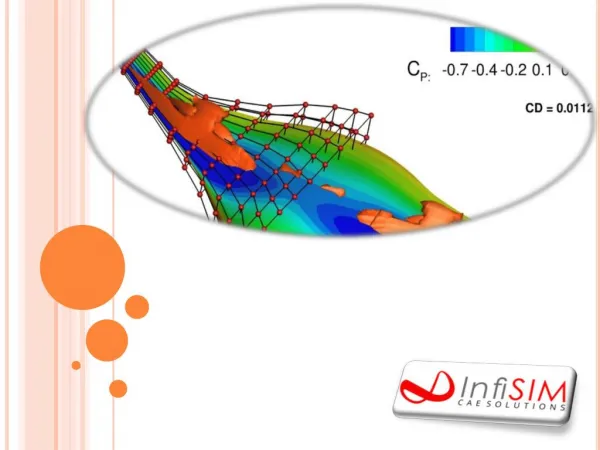
CFD analysis provides substantial insight on the pressure fluctuation, intensity of turbulence, pressure drop across stages and Acoustic level in the noise trim. • This helps product development team to virtually validate the noise attenuation ability of that particular design. • Image shown above is a cut-section of a noise trim used in a control valve. • Obtain reliable insights from an excellent CFD consulting servicesor an Structural Design Services company.
The following observations can be made – • Pressure contour (left) and velocity vectors (right) shows supersonic flow through the low noise trim. • Calculate acoustical conversion efficiency at each stage of the noise trim. • Intensity of turbulence coming into each stage due to restrictions. • Evaluate pressure drop ratio at each stage.
Conclusion • Coimbatore has the best Stress analysis services, which are provided by Graphler Technology Solution. • A team which is well experienced with 10 years industrial knowledge. Visit our websites or contact us for more information.