Download
1 / 54
580 likes | 773 Views
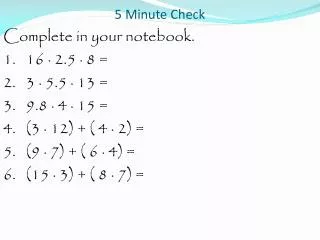
5 Minute Check. Complete by constructing ratio tables in your notes. 1.To make 5 apple pies, you need 2 pounds of apples. How many pounds of apples do you need to make 20 pies? 2. Four balls of wool will make 8 knitted caps. How many balls of wool will it take to make 6 caps?. 5 Minute Check.

E N D
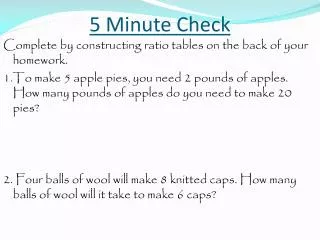
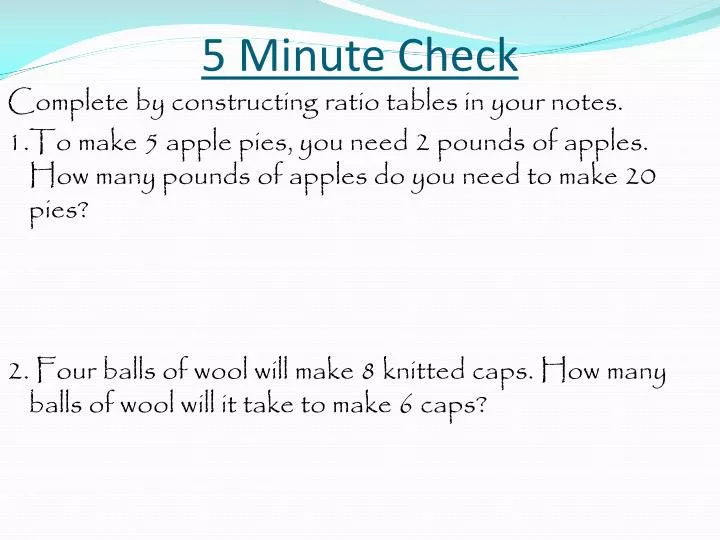
5 Minute Check Complete by constructing ratio tables in your notes. 1.To make 5 apple pies, you need 2 pounds of apples. How many pounds of apples do you need to make 20 pies? 2. Four balls of wool will make 8 knitted caps. How many balls of wool will it take to make 6 caps?
5 Minute Check 1.To make 5 apple pies, you need 2 pounds of apples. How many pounds of apples do you need to make 20 pies? 2. Four balls of wool will make 8 knitted caps. How many balls of wool will it take to make 6 caps?
5 Minute Check 1.To make 5 apple pies, you need 2 pounds of apples. How many pounds of apples do you need to make 20 pies? 2. Four balls of wool will make 8 knitted caps. How many balls of wool will it take to make 6 caps?
Thursday, Aug 28 Lesson 6.1.5 Graph Ratio Tables
Graph Ratio Tables Objective: Graph ordered pairs in ratio tables to solve problems.
Graph Ratio Tables In the ocean a shark is cruising at 150 feet per minute and a swordfish is swimming at 500 feet per minute. How many feet will the shark and swordfish swim in 2 minutes?
Graph Ratio Tables In the ocean a shark is cruising at 150 feet per minute and a swordfish is swimming at 500 feet per minute. How many feet will the shark and swordfish swim in 2 minutes? 300 feet and 1000 feet.
Graph Ratio Tables In the ocean a shark is cruising at 150 feet per minute and a swordfish is swimming at 500 feet per minute. How many feet will the shark and swordfish swim in 3 minutes?
Graph Ratio Tables In the ocean a shark is cruising at 150 feet per minute and a swordfish is swimming at 500 feet per minute. How many feet will the shark and swordfish swim in 3 minutes? 450 feet and 1500 feet.
Graph Ratio Tables In the ocean a shark is cruising at 150 feet per minute and a swordfish is swimming at 500 feet per minute. Which fish is swimming at a faster rate?
Graph Ratio Tables In the ocean a shark is cruising at 150 feet per minute and a swordfish is swimming at 500 feet per minute. Which fish is swimming at a faster rate? The swordfish.
Graph Ratio Tables Two rates can be graphed on the coordinate plane to compare at any point.
Graph Ratio Tables The coordinate plane is formed when two perpendicular number lines intersect at their zero points. The coordinate plane is also called the Cartesian plane after Rene Descartes, a French mathematician who invented it.
Graph Ratio Tables The coordinate plane is formed when two perpendicular number lines intersect at their zero points. The origin is the intersection of the zero points of the number lines.
Graph Ratio Tables The origin is the intersection of the zero points of the number lines. The horizontal number line is called the x-axis and the vertical number line is called the y-axis.
Graph Ratio Tables The origin is the zero points intersection of the number lines. The horizontal number line is called the x-axis and the vertical number line is called the y-axis. An ordered pair, such as (2,3), is a pair of numbers used to locate a point on the coordinate plane.
Graph Ratio Tables An ordered pair, such as (2,3), is a pair of numbers used to locate a point on the coordinate plane. The first number in the ordered pair is the x-coordinate, and the second number is the y-coordinate.
Graph Ratio Tables The Coordinate Plane
Graph Ratio Tables Graph the pair. A. (2,3)
Graph Ratio Tables Graph the pair. A. (2,3) A
Graph Ratio Tables Graph the pair. A. (2,3) B. (4, 6) A
Graph Ratio Tables Graph the pair. A. (2,3) B. (4, 6) B A
Graph Ratio Tables Graph the pair. A. (2,3) B. (4, 6) C. (6, 9) B A
Graph Ratio Tables C Graph the pair. A. (2,3) B. (4, 6) C. (6, 9) B A
Graph Ratio Tables C Graph the pair. A. (2,3) B. (4, 6) C. (6, 9) D. (0,0) B A
Graph Ratio Tables C Graph the pair. A. (2,3) B. (4, 6) C. (6, 9) D. (0,0) B A D
Graph Ratio Tables The table shows the cost in dollars to create CDs of digital photos at a photo shop. The table also shows this information as ordered pairs (number of CDs, cost in dollars). List the ordered pairs.
Graph Ratio Tables The table shows the cost in dollars to create CDs of digital photos at a photo shop. The table also shows this information as ordered pairs (number of CDs, cost in dollars). List the ordered pairs. (1,3) (2,6) (3,9) Graph these ordered pairs.
Graph Ratio Tables The table shows the cost in dollars to create CDs of digital photos at a photo shop. The table also shows this information as ordered pairs (number of CDs, cost in dollars). Graph these ordered pairs. (1,3) (2,6) (3,9) Describe the pattern in the graph.
Graph Ratio Tables The table shows the cost in dollars to create CDs of digital photos at a photo shop. The table also shows this information as ordered pairs (number of CDs, cost in dollars). Describe the pattern in the graph. The points appear to be in a line. Each point is one unit to the right and 3 units up from the previous point. The cost increases by $3 for every CD created.
Graph Ratio Tables The table shows Gloria’s earnings for 1,2 and 3 hours. The table also lists this information as ordered pairs (hours, earnings) List the ordered pairs.
Graph Ratio Tables The table shows Gloria’s earnings for 1,2 and 3 hours. The table also lists this information as ordered pairs (hours, earnings) List the ordered pairs. (1,5) (2,10) (3,15) Graph the ordered pairs.
Describe the pattern in the graph. Graph Ratio Tables The table shows Gloria’s earnings for 1,2 and 3 hours. The table also lists this information as ordered pairs (hours, earnings) Graph the ordered pairs. (1,5) (2,10) (3,15) Describe the pattern in the graph.
Graph Ratio Tables The table shows Gloria’s earnings for 1,2 and 3 hours. The table also lists this information as ordered pairs (hours, earnings) Describe the pattern in the graph. The points appear to be in a line. Each point is one unit to the right and 5 units up from the previous point. Her earnings increases by $5 for each hour.
Graph Ratio Tables The table shows Gloria’s earnings for 1,2 and 3 hours. The table also lists this information as ordered pairs (hours, earnings) By the way, what is wrong with this graph?
Graph Ratio Tables The table shows Gloria’s earnings for 1,2 and 3 hours. The table also lists this information as ordered pairs (hours, earnings) By the way, what is wrong with this graph? One box is one unit on the x-axis And 2 units on the y-axis. They should be the same.
Graph Ratio Tables Complete questions #1-4 on page 50 and questions #1-4 on page 51 of your math book. If you complete this, start on page 58.