Download
1 / 1
10 likes | 129 Views
HuT102. *. Mock myr-AKT. - + - +. LBH589. Annexin-V positive cells (%). p-AKT. 60kDa. AKT. 60kDa. Caspase-3. 35kDa. - + - +. LBH589. cleaved casp-3. 19/17kDa. Mock myr-AKT. 47kDa. Caspase-9. HuT102. cleaved casp-9. 37kDa. Caspase-2. 51kDa. 32kDa.

E N D
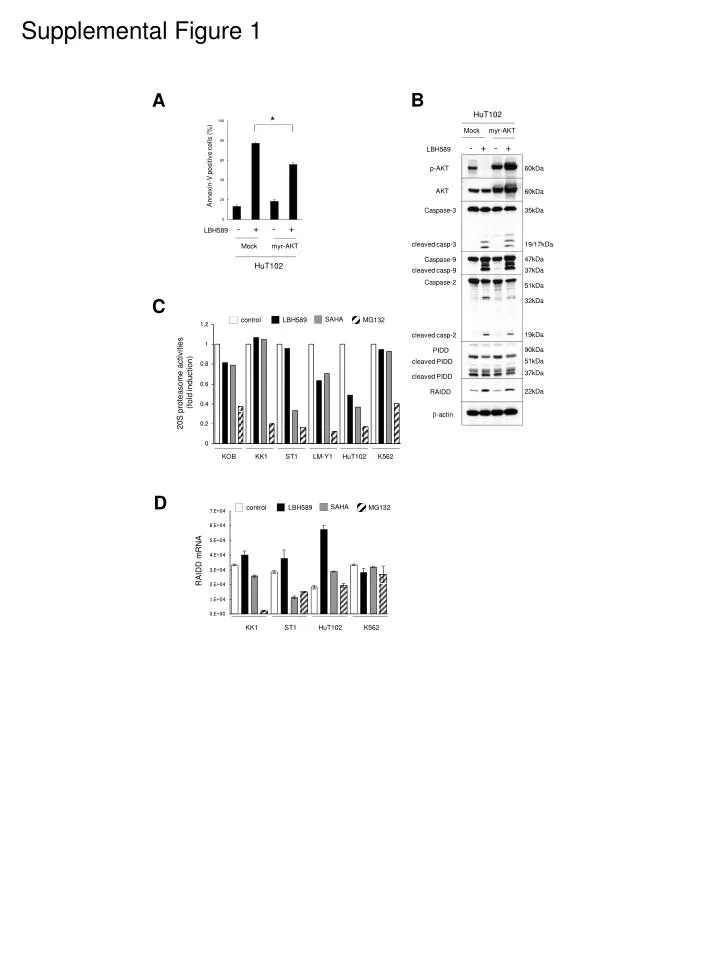
HuT102 * Mock myr-AKT - + - + LBH589 Annexin-V positive cells (%) p-AKT 60kDa AKT 60kDa Caspase-3 35kDa - + - + LBH589 cleaved casp-3 19/17kDa Mock myr-AKT 47kDa Caspase-9 HuT102 cleaved casp-9 37kDa Caspase-2 51kDa 32kDa 19kDa cleaved casp-2 90kDa PIDD 51kDa cleaved PIDD SAHA SAHA control control LBH589 LBH589 MG132 MG132 37kDa cleaved PIDD 22kDa RAIDD b-actin KOB KK1 ST1 LM-Y1 HuT102 K562 RAIDD mRNA KK1 ST1 HuT102 K562 Supplemental Figure 1 B A C 20S proteasome activities (fold induction) D