Download
1 / 7
90 likes | 241 Views
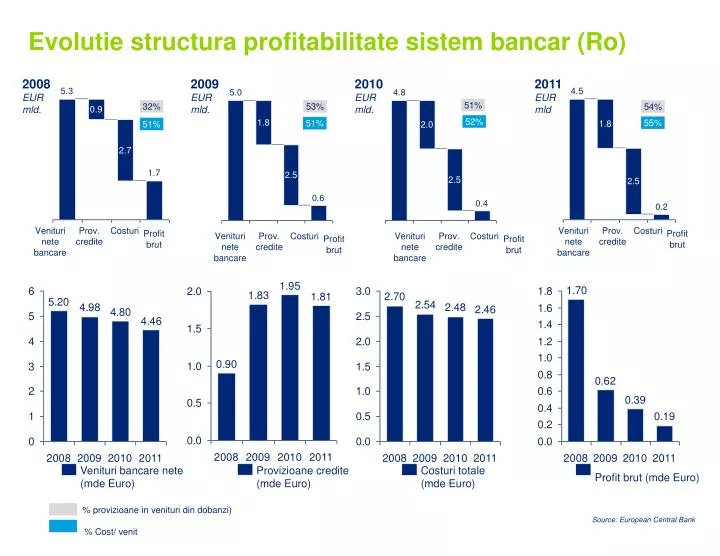
Evolutie structura profitabilitate sistem bancar (Ro). 2008 EUR mld. 2009 EUR mld. 2010 EUR m ld. 2011 EUR m ld. 51 %. 32 %. 53 %. 54 %. 0.9. 52 %. 55 %. 1.8. 51 %. 51 %. 1.8. 2.0. 2.7. 2.5. 2.5. 2.5. Venituri nete bancare. Prov. credite. Costuri.

E N D
Evolutie structura profitabilitate sistem bancar (Ro) 2008EUR mld. 2009 EUR mld. 2010 EUR mld. 2011 EUR mld 51% 32% 53% 54% 0.9 52% 55% 1.8 51% 51% 1.8 2.0 2.7 2.5 2.5 2.5 Veniturinetebancare Prov. credite Costuri Veniturinetebancare Prov. credite Costuri Profit brut Profit brut Veniturinetebancare Prov. credite Costuri Veniturinetebancare Prov. credite Costuri Profit brut Profit brut 2008 2009 2010 2011 2008 2009 2010 2011 2008 2009 2010 2011 2008 2009 2010 2011 Venituribancarenete (mde Euro) Provizioanecredite (mde Euro) Costuritotale (mde Euro) Profit brut (mde Euro) Source: European Central Bank % provizioane in venituri din dobanzi) % Cost/ venit
Comparatie principali indicatori bancari la nivel CE
Principalii indicatori bancari (Ro)