Download
1 / 6
90 likes | 355 Views
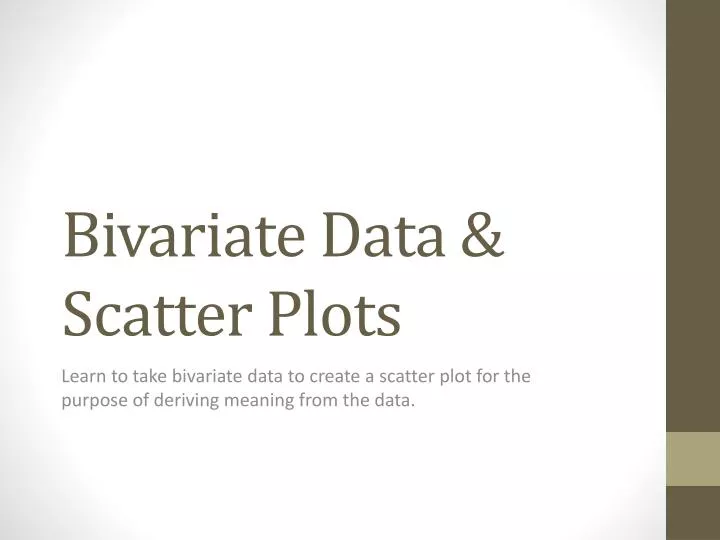
Bivariate Data & Scatter Plots. Learn to take bivariate data to create a scatter plot for the purpose of deriving meaning from the data. Scatter Plot. What is a scatter plot? A scatter plot is a graph that shows the relationship between two sets of data.

E N D
Bivariate Data & Scatter Plots Learn to take bivariate data to create a scatter plot for the purpose of deriving meaning from the data.
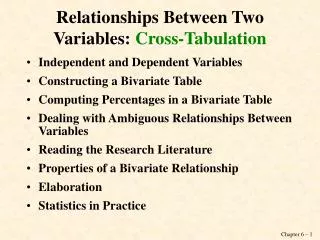
Scatter Plot • What is a scatter plot? • A scatter plot is a graph that shows the relationship between two sets of data. • Each point on the graph is an ordered pair. (x, y) • By how the points are grouped or not grouped, you can determine if the data is related. • Types of correlation: NO CORRELATION POSITIVE NEGATIVE
Example 1: • 8 people were surveyed to find their shoe size and height. • It’s hard to see a relationship between all of this data, so lets look at it as a scatter plot. • Shoe size will be our “x” and height will be our “y.” This will make an ordered pair.
Example 1 continued… • Plot the data from the table onto the graph. • What can you conclude from this data? • According to our data, the height of a person is related to their shoe size. • Generally, the larger the shoe size, the taller the person.
Activity: Ice Cream & Temperature • An ice cream shop keeps track of how much ice cream they sell versus the temperature on that day. Here are their figures for the last 12 days: • What can you conclude from this data? • If we take this data and create a scatter plot, we will be able to draw a conclusion. • Each student will plot this data on a scatter plot.
Scatter Plot… • What can you conclude from this data? • It is now easy to see that warmer weather leads to more sales .