Download
1 / 31
1.12k likes | 2.85k Views
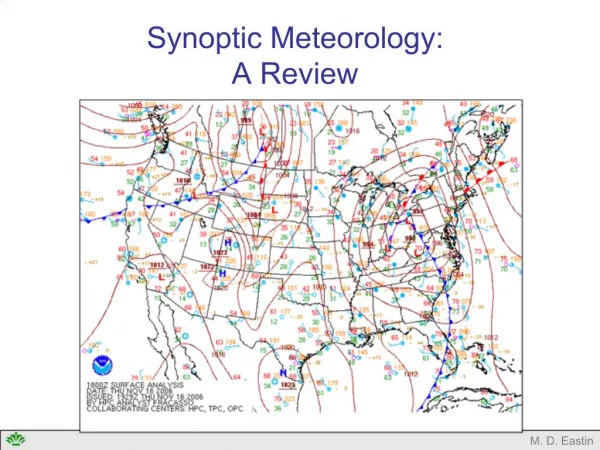
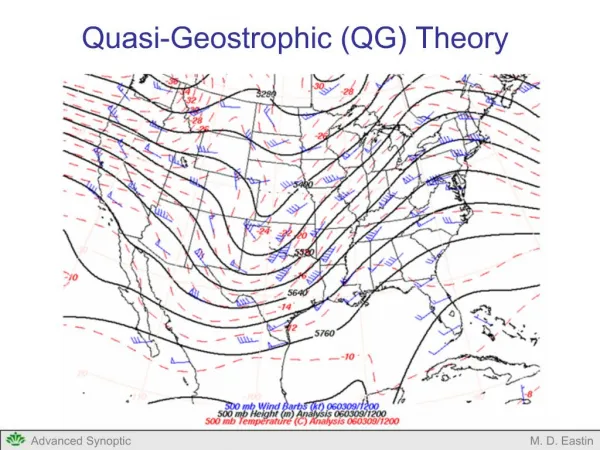
Synoptic Charts. Weather Discussion 2009 Sarah Kew. Synoptic charts. Synoptic charts are drawn every 3 hours (00, 03, 06 UTC etc) Measurements from about 400 land/sea stations plotted on Europe chart Drawn onto chart: Isobars (every 5 hPa) fronts (cold, warm, occluded)

E N D
Synoptic Charts Weather Discussion 2009 Sarah Kew
Synoptic charts • Synoptic charts are drawn every 3 hours (00, 03, 06 UTC etc) • Measurements from about 400 land/sea stations plotted on Europe chart • Drawn onto chart: • Isobars (every 5 hPa) • fronts (cold, warm, occluded) • Highs (H) and Lows (T) Cold front Occluded front Warm front
Why? Old fashioned?! • Overview over current weather situation • What’s going on • Good starting point for making forecast
Outline • Decoding the measurements • Drawing isobars and fronts • Synoptic charts for typical Alpine weather situations
What is measured? • Pressure • Pressure tendencies • Air and dewpoint Temperature • Wind speed and direction • Current and past weather • Cloud cover, type, height • Visibility
The Station Circle Pressure (1018.3 hPa) Wind (30 kt, WNW) Cloud cover (8 oktas) Weather (Fog) Pressure tendency (rising 2.1 hPa in 3 hours)
The Station Circle Pressure (1018.3 hPa) Wind (30 kt, WNW) Cloud cover (8 oktas) Weather (Fog) Pressure tendency (rising 2.1 hPa in 3 hours)
The Station Circle 998.4 hPa Pressure (1018.3 hPa) Wind (30 kt, WNW) Cloud cover (8 oktas) Weather (Fog) Pressure tendency (rising 2.1 hPa in 3 hours)
The Station Circle Medium-level cloud (Ac with Ns) Pressure (1018.3 hPa) Air temperature (13 C) Visibility (12 km) Wind (30 kt, WNW) Cloud cover (8 oktas) Weather (Fog) Past Weather (rain) Dew point Temperature (9 C) Low cloud Type (Sc) Pressure tendency (rising 2.1 hPa in 3 hours) Low cloud base height (500 m) Low cloud Cover (4/8)
How? • Remember drawing by numbers?
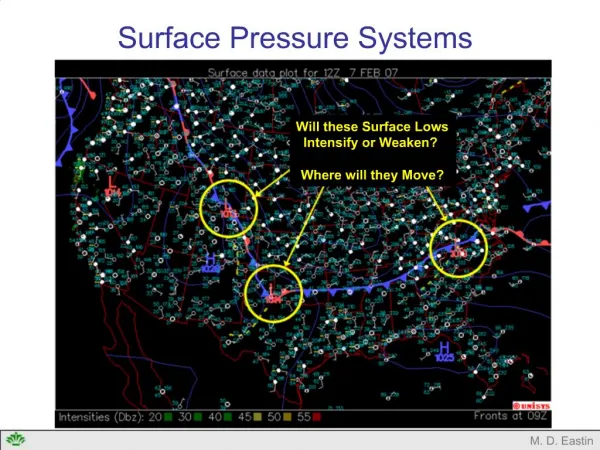
Identifying highs and lows • Pressure minimum • Anticlockwise winds • Fronts • Pressure maximum • Clockwise winds
How to find the front? • Clouds • Precipitation • Wind change • Isobars • Temperature • Dew Point • Visibility • Satellites http://atschool.eduweb.co.uk/kingworc/departments/geography/nottingham/atmosphere/pages/gfx/
Weather/Precipitation • Mark rain (light/strong) • Mark fog • Mark Thunderstorms snow cb fog light rain strong rain shower thunderstorm
Pressure tendency • Mark pressure fall and rise 38 28 17 8
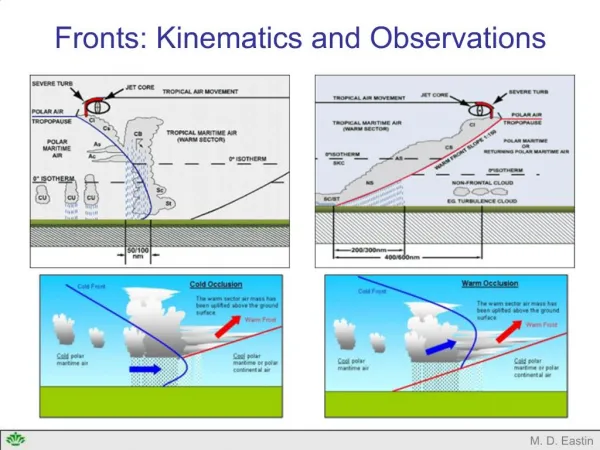
How to find the front? Warm front: • Pressure decrease ahead of front, then constant • Increase in temperature • Increase in dew point • Wind jump at front • Cirrus ahead of front • Light rain and then increasing but usually not convective
How to find the front? Cold front: • Pressure decrease ahead of front • Strong pressure increase behind front • Decrease in temperature • Wind jump at front • Convective clouds • Strong rain, showers, thunderstorms
How to find the front? Occlusion: • Joining of cold and warm front • Heaviest rain usually at occlusion point http://apollo.lsc.vsc.edu/classes/met130/notes/chapter11/graphics/of_co_schem.jpg http://www.qc.ec.gc.ca/meteo/images/Fig_8-9_a.jpg
T T H Finished Chart 20/03/02 00 UTC
Typical Alpine Weather Situations Recognise patterns in synoptic charts predict local effects missed by models
West-wind • Straight westerly upper flow • Succession of waves on polar front, 1-2 day separation • Few days - 1 week • Autumn to Spring • Variable weather, particularly Alpine North side
West-wind • Extensive cloud band on the warm front, thicker as front approaches • Isolated clouds in warm sector • Narrow cloud band on cold front • Thunderstorms in summer • Convective clouds behind cold front (daytime)
Bise • East – Northeast flow called the “Bise” • Low level: air channelled between Alps and Jura • Wind speed increases as separation narrows • Above: large scale subsidence • Summer: dry air, fine weather, pleasant temperatures • Winter: fog, if relative humidity high enough
Bise • Warm dry subsiding air above, separated from moist air below by inversion • Turbulence due to high wind speed, but rising air trapped by inversion • Height of fog base depends on humidity • Solar heating insufficient to evaporate fog (winter)
South Foehn • South – southwest flow over Alps • Cold front over east France • “S”-form of isobars is typical • Pressure in Zurich 10-15 hPa lower than in Locarno • Hours - days
South Foehn • South side: Ascending air cools, clouds form accumulate and thicken, and it starts to rain • North side: Drier descending air warms, 10C warmer than south side, clouds evaporate, “Foehn-hole” • Lee side: Buoyancy waves - Lenticular clouds, rotors
North Foehn • Moist air from North-Sea approaches Alps • Pressure in Zurich 15 hPa higher than in Locarno • Clouds pile up on north-side • Precipitation mainly in central and east parts of Alpine North side • West still influenced by stable high • Clear skies in Ticino and Bergell • Lee-waves and rotors to South
High Pressure • Very light winds • Sinking air warms, lowers relative humidity, evaporates clouds • Days – several weeks • Summer: fine weather • Winter: radiation fog • 200 m thick • Nov-Jan not always evaporated
Flat Pressure Distribution • Only weak extrema • large spacing between isobars, light winds • Typical in summer • Absence of subsidence allows convective clouds to develop • Thunderstorms over Jura and Alpine foothills
What do we have now? Mo 23-03-09 18 UTC