Download

1 / 40
400 likes | 536 Views
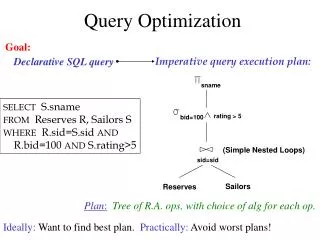
Query Optimization over Web Services. Utkarsh Srivastava Jennifer Widom Kamesh Munagala Rajeev Motwani. Performance Numbers. Student. Advisor. Relative Contribution to Research. 100. 80. This Work. 60. Percent Contribution. 40. 20. 0. 0. 1. 2. 3. 4. 5.

E N D
Query Optimization overWeb Services Utkarsh Srivastava Jennifer Widom Kamesh Munagala Rajeev Motwani
Performance Numbers Student Advisor Relative Contribution to Research 100 80 This Work 60 Percent Contribution 40 20 0 0 1 2 3 4 5 Time in Program (years)
Future Directions (sample) • Web services with monetary cost • Web services with unstable response times (QoS guarantees?) • Multiple web services for same data • Caching web-service query results • More expressive queries, also workflows • Web service profiling and statistics-tracking
First Steps in Big Problem Our contribution New Query Optimization Problem
Web Services • Standardized way of sharing data and • functionality • Description and discovery • Communication Data, Functionality WSDL,UDDI Web Services Users/ Clients SOAP
Example Web Services Stock symbol WS1 Company info Reuters Stock symbol WS2 Stock activity NASDAQ
Querying Across Web Services Get info about all companies with high-activity stock Stock symbol WS1 Company info Query User/ Client Reuters Results • Easy • Transparent • Efficient • Etc. Stock symbol WS2 Stock activity NASDAQ
Same Basic Goal as Traditional DBMS Declarative Interface Query User/ Client Data Database Management System Results • Easy • Transparent • Efficient • Etc.
Web Service Management System WS1 Query User/ Client Reuters Reuters Results WS2 NASDAQ Web Service Management System • Easy • Transparent • Efficient • Etc.
WSMS Architecture WSMS Declarative Interface WS Invocations Metadata Component Schema mapper Web service registration WS1 Query + input data Query Processing Component WS2 Client Plan selection Plan execution Results Profiling and Statistics Component WSn Statistics tracker Response- time profiler
Running Example • Credit card company wants to send offers to • people with: • credit rating > 600, and • payment history = “good” on prior credit card • Company has at its disposal: L : List of potential recipients (identified by SSN) WS1 : SSN credit rating WS2 : SSN cc number(s) WS3 : cc number payment history
Plan 1 SSN WSMS WS1 SSN,cr SSNcr Filter on cr, keep SSN L(SSN) Query Plan WS2 Client SSNccn SSN,ccn WS3 SSN,ccn,ph ccnph Filter on ph, keep SSN Note: Pipelined processing
Simple Representation of Plan 1 WS1 WS2 WS3 L Results ccnph SSNcr SSNccn
Plan 2 WSMS WS1 SSN SSN,cr SSNcr Filter on cr, keep SSN SSN SSN L(SSN) WS2 Client Join SSNccn SSN,ccn WS3 SSN SSN,ccn,ph ccnph Filter on ph, keep SSN
Simple Representation of Plan 2 SSNcr WS1 L Results WS2 WS3 SSNccn ccnph
Quiz Which plan is better? Plan 1 WS1 WS2 WS3 L Results WS1 Plan 2 L Results WS2 WS3 • Cost metric:steady-state throughput • Assume join is “free” Plan 1 is never worse
Query Optimization Primer • Possible query plans:P1, …, Pn • Data/access statistics:S • Execution cost metric:cost(Pi, S) • GOAL: Find least-cost plan
Query Optimization Primer • Possible query plans:P1, …, Pn • Data/access statistics: S • Execution cost metric: cost(Pi, S) • GOAL: Find least-cost plan
Queries and Plans • “Select-Project-Join” queries over input dataL • and set of web services WS1, …, WSn • Precedence constraints Output of WSi may be needed as input forWSj Ex: WS2:SSN ccn and WS3:ccn ph • Precedence DAG defines space of query plans
Query Optimization Primer • Possible query plans: P1, …, Pn • Data/access statistics:S • Execution cost metric: cost(Pi, S) • GOAL: Find least-cost plan
Statistics Our contribution • Web service response times • Web service selectivities New Query Optimization Problem
Statistics: Response Times Our contribution • ri: per-tuple response time of WSi from client SSN Client WS1 SSNcr cr r1 • ri ≈1/throughput, can be reduced by batching, parallel calls batching (see paper) • Assume independent response • times within query plans New Query Optimization Problem
Statistics: Selectivities Our contribution • si: selectivity of WSi • Average # output tuples per input tuple toWSi • including post-filtering in query plan WS1: SSN cr, filter cr > 600 If 90% of SSNs have cr > 600 then s1 = 0.9 WS2: SSN ccn If on average each SSN has 2 credit cardsthen s2 = 2.0 • Assume independent • selectivities within query plans New Query Optimization Problem
Query Optimization Primer • Possible query plans: P1, …, Pn • Data/access statistics: S • Execution cost metric:cost(Pi, S) • GOAL: Find least-cost plan
Bottleneck Cost Metric Our contribution New Query Optimization Problem
Bottleneck Cost Metric Conference Lunch Buffet Dish 1 Dish 2 Dish 3 Dish 4 Average per-tuple processing time = response time of slowest (bottleneck) stage in pipeline Note: selectivities=1 in this example
Cost Equation for Plan P • Ri(P): Predecessors of WSi in plan P Πj∈Ri(P) sj • Fraction of input tuples seen byWSi= (Πj∈Ri(P) sj)•ri • WSiresponse time per input tuple = • Bottleneck cost metric: cost(P) = max1≤i≤n( (Πj∈Ri(P) sj)•ri ) (assumes WSMS processing is not the bottleneck)
Contrast with Sum Cost Metric cost(P) =∑1≤i≤n( (Πj∈Ri(P) sj)•ri ) • Stream filter ordering • Expensive predicate placement “Polite” Lunch Buffet Dish 1 Dish 2 Dish 3 Dish 4
Problem Statement • Input: • Web services WS1, …, WSn • Response times r1, …, rn • Selectivities s1, …, sn • Precedence constraints among web services • Output: • Web services arranged into a plan P • P respects all precedence constraints • cost(P) is minimized
No Precedence Constraints • All selectivities ≤ 1 • Theorem:Optimal to order linearly by ri • (selectivities irrelevant) • General case • (optimal): “proliferative” web services “selective” web services ordered by response-time … join at WSMS Results
With Precedence Constraints cost(P) = max1≤i≤n( (Πj∈Ri(P) sj)•ri )
With Precedence Constraints 100 80 60 Student Percent Contribution Advisor 40 20 0 0 1 2 3 4 5 Time in Program (years) cost(P) =∑1≤i≤n( (Πj∈Ri(P) sj)•ri ) • Sum cost metric • Hard to even obtain a factorO(n) of optimal
With Precedence Constraints 100 80 60 Student Percent Contribution Advisor 40 20 0 0 1 2 3 4 5 Time in Program (years) cost(P) = max1≤i≤n( (Πj∈Ri(P) sj)•ri ) • Bottleneck (max) cost metric • Surprisingly, optimal solution in polynomial time • O(n5) algorithm in paper • Add one WS at a time to the plan • WS chosen by solving a linear program
Example Revisited Plan 1 WS1 WS1 WS2 WS2 WS3 WS3 L Results SSNcr SSNccn ccnph SSNcr max1≤i≤n( (Πj∈Ri(P) sj)•ri ) WS1 WS1 Plan 2 L Results WS2 WS2 WS3 WS3 SSNccn ccnph Selective WS3 WS2 Precedence constraint Proliferative
Implementation • Built prototype WSMS query processor • Optimizer and execution engine • Assumes schema issues resolved, statistics provided • Written in Java and uses Apache Axis (open-source SOAP implementation) • Experiments (see paper) validate analytical results
Isn’t Problem the Same as … ? • Web Service composition • Targeted for workflow-oriented applications • No provably optimal strategies • Parallel/distributed query optimization • Freedom to place query operators • Much larger space of execution plans • Data integration, mediators • For general sources of data • Optimization of total resource consumption
Future Directions (sample) • Web services with monetary cost • Web services with unstable response times (QoS guarantees?) • Multiple web services for same data • Caching web-service query results • More expressive queries, also workflows • Web service profiling and statistics-tracking
Conclusion Our contribution New Query Optimization Problem
Conclusion New Query Optimization Problem Our contribution
Questions? Student Advisor 100 80 60 Percent Contribution 40 20 0 0 1 2 3 4 5 Time in Program (years)