Download
1 / 39
400 likes | 588 Views
Environmental Services Monitoring Systems. Moderator : Leslie Teachout MT (ASCP), CIC Infection Prevention Riverton Memorial Hospital/Lander Regional Hospital. Monitoring of Environmental Services. Kelly Klingsporn, EVS/Laundry Supervisor. 3M™ Clean-Trace™ Hygiene Management System.

E N D
Environmental Services Monitoring Systems Moderator: Leslie Teachout MT (ASCP), CIC Infection Prevention Riverton Memorial Hospital/Lander Regional Hospital
Monitoring of Environmental Services Kelly Klingsporn, EVS/Laundry Supervisor
3M™ Clean-Trace™ Hygiene Management System • 10% sampling of all patient rooms every 4 months with an 80% pass rate • 16 Rooms/4 a month/One a week • http://www.cdc.gov/hai/toolkits/evaluating-environmental-cleaning.html • 12 test points in patient rooms
Preparing Staff • Environmental Services • Education on the product we were going to use • How often we would be testing • What areas were the “high touch” areas • How the information was going to be used • We spent time testing areas before they were cleaned and then again after
Why are we doing this? • NOT A PUNISHMENT • Training • Education • Monitor how effective our products are • How effective we are with our cleaning techniques • Awareness to all staff • CDC recommendation and wanted to have a program in place when it became mandatory
Why are we doing this? • NOT A PUNISHMENT • Training • Education • Monitor how effective our products are • How effective we are with our cleaning techniques • Awareness to all staff • CDC recommendation and wanted to have a program in place when it became mandatory
What do we do with the data • Share with all staff • Report out to the leadership team • Report out to the infection prevention team • Report out on a system level to the EVS discipline team • As a system Banner Health decided to follow the CDC recommendation • As an EVS system team, what touch points and what the pass/fail threshold was set the same for all facilities (over 400 is fail)
Additional testing • Started monitoring OR once a month. • Working on a test plan for the Emergency Department
Critical Touch Point Inspection Using an ATP Luminometer Presented By:Randy da’ Camara Environmental Services Director Riverton Memorial and Lander Regional Hospital
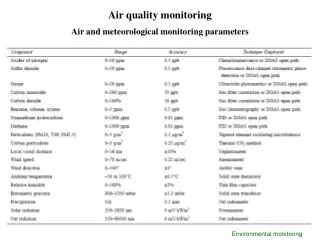
What Is ATP ? ATP is an energy molecule found in all living cells that allows cellular metabolism to take place. All organic matter contains ATP, Including blood, saliva, and bacteria. In healthcare facilities, organic matter such as bodily fluids, blood and specific bacteria left on surfaces can become a point of cross contamination between patients and staff leading to infections if not properly cleaned. Therefore the detection of ATP on a surface after cleaning is an indication of improper cleaning and that bacteria or bio-burden that can support growth is still present on the surface.
Measuring ATP with Bioluminescence Technology.Ultra-Snap ATP surface tests contain an enzyme called luciferase/luciferin which produces a bioluminescence (light producing) reaction when it comes into contact with atp. Using bioluminescence technology, the ATP Luminometer can measure low levels of atp collected with the ultra-snap test device.
Extremely user friendly A Luminometer can cost anywhere from $900.00 to $ 1,700.00each test swab cost about $1.50Weekly Testing ( I generally choose three rooms in an area and pick three different surfaces to test in each room.Testing Parameters Measured in RLU’s (Relative Light Units): Pass: <10 Caution: 11-29 Fail: >30Common Cleaning Mistakes: Not changing out cleaning rags enough, Not using enough rubbing friction, wet mopping instead of damp mopping or not changing mop head enough each rom may take several mops if heavily soiled, not polishing of stainless steel with dry rag.
1. Door Knob 7. I.V. Pump / Pole 2. Light Switch 8. Sink Faucet Knobs 3. Bed Rails 9. Toilet Flush Handle 4. Nurse Call / T.V. Remote 10. Grab Bars 5. Over Bed Table 11. Chair Arms 6. Telephone 12. B.P. Cuff / Robot High Contact surfaces Typically Tested.
Positive: • Evidence based Cleaning practice • Real time results and tracking • Great Educational Opportunity for staff. Results actually encourages staff to strive for performance. • Negative: • Expensive Device and Swab tests • Not compatible with chemicals containing phosphates • Does not test for specific bacteria just Organic material. Pros and cons
Q & A Thank you: For future Reference I may be contacted by e-Mail: randy.Dacamara@lpnt.net
HOT SPRINGS CO MEMORIAL HOSPITALGriff Hodson ENVIRONMENTAL SERVICE THE CLEAN TEAM
Monitoring of Environmental Cleaning Linda Lueras, CCMH Environmental Services Coordinator Interim EVS Manager
Starting New Quality Process • CCMH EVS utilizes 3M clean trace with swabs • Purchased 3-4 years ago • Initially used for education and demonstration for staff • Introduced at monthly meetings
Improve quality • Utilized CDC site for high touch areas • Developed check off list – to test with clean trace • Next slide shows items identified
Process • Twice a week, random selection of staff and area. • Before readings are taken without staff in area. • after cleaning swabs are obtained and readings taken with staff • WIC example (pen)
Process • Readings show biomatter, chemical residue, dust, etc. • Readings of 200 and below are clean • Readings of 201 – 300 are “grey” area per machine.. • Readings over 300 are “dirty” • CCMH uses clean or dirty and anything above 200 is recleaned
Other uses • Investigate new chemicals for effectiveness and to check wet time • Education for staff
Barriers • Initially concerned about cost, however put into annual budget as quality resource tool. • Management very supportive • Staff initially concerned it could be punitive • Now staff excited, involved in process and learn from each other.
Quality report • Monthly a report is sent to managers of the area inspected. • Every two months a report is provided to Infection Prevention Committee to demonstrate cleaning process.
Success/lessons • Staff involvement • Clean trace on whirlpool tubs at LTC, due to increase in UTI’s and identified one tub not clean, staff educated and UTI numbers decreased • Quality checks especially after isolation • Questions? • Contact information: Linda Lueras, CCMH linda.lueras@ccmh.net