Download
1 / 21
210 likes | 347 Views
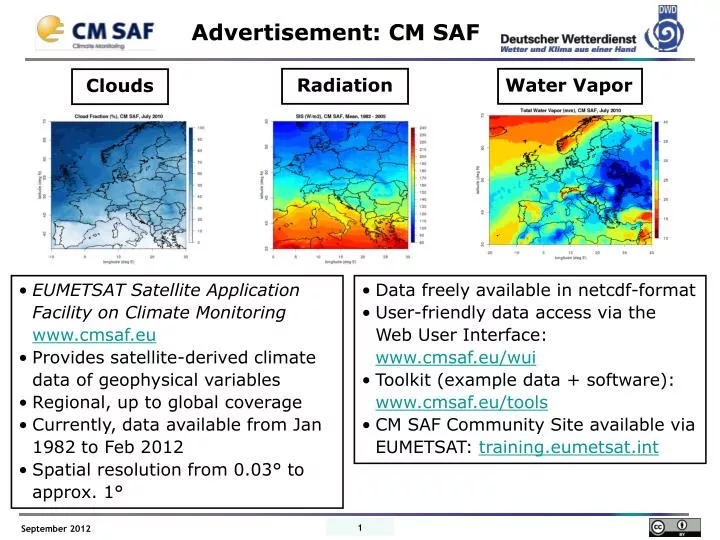
Advertisement: CM SAF. Radiation. Water Vapor. Clouds. EUMETSAT Satellite Application Facility on Climate Monitoring www.cmsaf.eu Provides satellite-derived climate data of geophysical variables Regional, up to global coverage Currently, data available from Jan 1982 to Feb 2012

E N D
Advertisement: CM SAF Radiation Water Vapor Clouds • EUMETSAT Satellite Application Facility on Climate Monitoringwww.cmsaf.eu • Provides satellite-derived climate data of geophysical variables • Regional, up to global coverage • Currently, data available from Jan 1982 to Feb 2012 • Spatial resolution from 0.03° to approx. 1° • Data freely available in netcdf-format • User-friendly data access via the Web User Interface: www.cmsaf.eu/wui • Toolkit (example data + software): www.cmsaf.eu/tools • CM SAF Community Site available via EUMETSAT: training.eumetsat.int
Analyzing the Stability of Gridded Surface Radiation Data Sets Jörg Trentmann1, Richard Müller1, Arturo Sanchez-Lorenzo2, Martin Wild2 1Deutscher Wetterdienst, EUMETSAT Satellite Application Facility on Climate Monitoring (CM SAF)2Eidgenössische Technische Hochschule (ETH), Zürich
Motivation • Gridded Climate Data Sets (e.g., satellite, reanalysis, surface obs) become increasingly available • Three aspects of Climate Data Records should be evaluated: • Climatology (mean) • Temporal Variability (anomalies) • Temporal Stability (trend) • Validation of gridded data sets often does not assess the temporal stability / homogeneity • Validation of a satellite-derived climate data set of solar irradiance using surface measurements
Data Set • CM SAF Meteosat(Posselt et al., 2012) • 1983 – 2005; 0.03 deg; Meteosat Full Disk, monthly/daily/hourly • 6 different satellite instruments (of the same type) used! Does this data set fulfill the requirements for climate quality?
Reference Data Set • GEBA: • Global Energy Balance Archive, hosted at ETH Zürich • > 200 surface stations globally • starting 1930s • Here: ca. 50 European stations starting 1983
Data Set Validation • Validation Strategy: • Climatological measures (mean, variability) • Evaluation of the stability • Comparison of linear trends • Temporal evolution of the bias • Application of homogeneity test
Results: Climatology • Bias in the order of ± 5 W/m2 • Absolute bias: ~ 10 W/m2 • Correlation of anomalies between 0.8 and 0.9
Data Set Evaluation • Evaluation Strategy: • Climatological measures (mean, variability) • Evaluation of the stability • Comparison of linear trends • Temporal evolution of the bias • Application of homogeneity test
1. Compare Linear Trends Warszawa: CM SAF Meteosat / GEBA • Positive trends in both time series: GEBA: +5.3 W/m2/dec • CM SAF: +2.3 W/m2/dec • Trends agree within their level of significance
1. Compare Linear Trends Mean all stations: CM SAF Meteosat / GEBA Positive trends in both time series: GEBA: +3.6 W/m2/dec CM SAF: +1.8 W/m2/dec
Data Set Evaluation • Evaluation Strategy: • Climatological measures (mean, variability) • Evaluation of the stability • Comparison of linear trends • Temporal evolution of the bias • Application of homogeneity test
2. Analyze Bias Time Series Warszawa: CM SAF Meteosat GEBA Significant negative trend of 3 W/m2/dec in the bias time series
2. Analyze Bias Time Series Mean all stations: CM SAF Meteosat GEBA Significant negative trend of 1.76 W/m2/dec in the mean bias time series
Data Set Evaluation • Evaluation Strategy: • Climatological measures (mean, variability) • Evaluation of the stability • Comparison of linear trends • Temporal evolution of the bias • Application of homogeneity tests
3. Homogeneity Test Penalized Maximum T test(PMT, Wang et al., 2008): Warszawa: CM SAF Meteosat GEBA • Detects changes of the mean • Model assuming constant values and (multiple) shifts • Software and documentation readily available
3. Homogeneity Test • No clear shift detected in all time series • Maximum of (negative) shifts in 1993-1995 • Very few shifts after 1995
3. Homogeneity Tests Homogeneity Test (SNHT) • Shifts detected in 1987 and 1994 (corresponding to changes in satellite) • No shift detected after 1994, data set is homogeneous between 1994 and 2005
1. Linear Trends (> 1994) Compare CM SAF Meteosat / GEBA after 1994 Trend Bias • Consistent linear trends (~ 4.6 W/m2/dec) • Zero trend in the bias time series • High homogeneity of the CM SAF Meteosat data set after 1994 in Europe
Trend in Surface Radiation Spatial distribution of linear trend (1994 – 2005) based on CM SAF Meteosat • Substantial variability (decrease in Mediterranean!) • Mean Trend: 3.1 W/m2/dec
Conclusions • Temporal stability of gridded climate data setsneed to be evaluated • Linear trends in surface irradiance in Europe tend to be reproduced by CM SAF data set • Inhomogeneities have been detected in theCM SAF data set before 1994 • The trend in surface irradiance in Europe between1994 and 2005 is spatially inhomogeneous • Outlook: • Compare with independently-derivedgridded data sets (e.g., surface obs,reanalysis) • Evaluate the homogeneity of the surfacedata using multiple gridded data sets