Download
1 / 106
1.14k likes | 1.32k Views
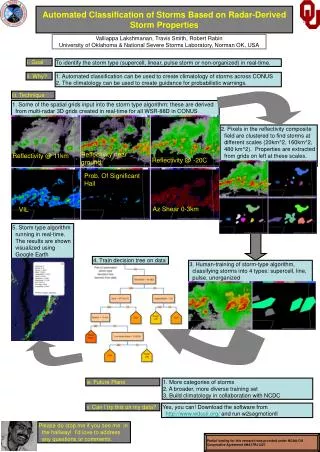
Severe storm radar signatures. Jim LaDue Warning Decision Training Branch, NWS Norman, OK. James.G.LaDue@noaa.gov. Topics. Estimating updraft strength Mesocyclones Assessing the potential for Severe winds Large hail Tornadoes Heavy rainfall. Updraft strength estimation.

E N D
Severe storm radar signatures Jim LaDue Warning Decision Training Branch, NWS Norman, OK James.G.LaDue@noaa.gov
Topics • Estimating updraft strength • Mesocyclones • Assessing the potential for • Severe winds • Large hail • Tornadoes • Heavy rainfall
Updraft strength estimation • Upper level reflectivity core • Storm reflectivity and velocity structure • Low-level convergence
Elevated reflectivity core • Where does the precipitation form relative to the freezing level? • How high does the precipitation extend? Link to loop
Case 1: July 10, 2003 very severe reflectivity profile 2.4º 3.4º 5.3º 7.5º 10.0º 0.5º • Let’s examine the reflectivity profile of storm K0 and compare it to the Severe Hail Index as determined by the previous page
Case 1: July 10, 2003 very severe reflectivity profile • 0109 UTC • Deep, high reflectivity well above/below –20 C level VIL = 83 kg/m2 VIL density = 4.94 g/m3 MEHS = 3” -20° C 0° C Z=55dBZ Result: baseball hail
Case 1: July 10, 2003 very severe reflectivity profile • 0109Z • Values are integrated upward • The Severe Hail Index integrates the vertical reflectivity profile • Hail Detection Algorithm (HDA) converts this to estimated hail size Note how rapidly the SHI increases above the 0 °C level -20° C 0° C POSH=90%
Case 2: July 10, 2003 Nonsevere updraft 0.5º 2.4º 3.4º 5.3º 7.5º 10.0º • Let’s examine the reflectivity profile of storm F6 and compare it to the Severe Hail Index as determined by the HDA worksheet
Case 1: July 10, 2003 nonsevere reflectivity profile • 0109 Z • Bottom-heavy and weak reflectivity storm F6 Storm parameters for cell F6 VIL = 42 kg/m2 VIL density = 2.7 g/m3 MEHS=.75” -20° C 0° C Z=55dBZ
Case 1: July 10, 2004 nonsevere reflectivity profile -20° C 0° C • July 10, 2003 – Wichita • Note that SHI responds exponentially less given 10-15 dBZ lower reflectivities in this storm Storm parameters for cell F6 VIL = 42 kg/m2 VIL density = 2.7 g/m3 MEHS=.75” POSH=90% Result: no severe reports
Interim summary: updraft intensity through upper-level reflectivity • Use the higher slices to detect the towering cumulus above the boundary layer echoes • Look for the first strong core to develop above the freezing layer. • More severe storms have • higher elevated reflectivities • and more top heavy vertical reflectivity profile • Slightly smaller reflectivity aloft leads to large changes in expected weather
Severe updraft structural signatures • Objective: Understand how the following signatures are an indication of, or contribute to severe updrafts in convection • WERs • BWERs • Stormscale velocity
Nonsevere storm structure • Upper level storm top lies over low-level reflectivity maximum • Lower reflectivities overall • Low height of reflectivity thresholds
Severe sheared storm structure • Upper level storm top lies over low-level reflectivity gradient on the side of low-level storm relative inflow • Strong echo overhanging a Weak Echo Region (WER)
Trailing mesocyclone supercell updraft storm structure • Upper level storm top lies over low-level WER • Sometimes a BWER (Bounded Weak Echo Region) • Sustained intense elevated reflectivity core • A mesocyclone
Severe sheared updraft intensity – BWER detection • BWER (Bounded Weak Echo Region) Needs a connection to the low-level WER 3.4° BWERs difficult to detect this far out 2.4° Typical BWER detection tops off near the -20° C level 1.5° -20° C 0.5°
Classic severe updraft signature case • Trailing updraft • Normal width • Produced a few record sized hailstones BWER = 2mi max size -20° C
Severe updraft in a squall line segment • Squall line moving 52 kts • Storm top 26 kft AGL • Is there a WER? The ‘forward jump’ in the reflectivity from 2.4 to 3.4° is more than just movement between elevation slices -20° C
Conceptual model of a more severe linear system updraft • Key things to note are the • Relatively nondescending RIJ • Front end echo overhang with linear BWER ahead of the surface gust front • Deep convergence zone
Updraft strength – Low-level convergence • Convergence parameters to affect updraft magnitude • magnitude • depth • residence time of storm over convergence
Updraft strength – Low-level convergence depth 20 m/s Assuming a steady state convergence Depth: Z = 2 km Boundary width = 1 km (one .54 nm range gate) Mean convergence over 1 km: V = 10ms-1 / 1000m = .01 s-1 Updraft strength at 2 km W = (V) Z = .01s-1 *2000m = 20 m/s Convergence V is simplified to be V/width or 10 m s-1 /1000 m 10 kts (5 m/s) 6500ft - 2 km 1 km
Updraft strength – Low-level convergence depth Assuming a steady state convergence Depth: Z = 3 km Boundary width = 1 km (one .54 nm range gate) Mean convergence over 1 km: V = 10ms-1 / 1000m = .01 s-1 Updraft strength at 3 km W = (V) Z = .01s-1 *3000m = 30 m/s 30 m/s 10000ft - 3 km 10 kts (5 m/s) 1 km
A severe upright convective system with deep, strong convergence • Deep Convergence zone • What do you think the spotter’s seeing? 15 kft
Conceptual model of a less severe linear system updraft • Key things to note are the • Descending RIJ • No deep convergence zone • Shallow sloping updraft over top of cold pool with numerous discrete cells merging into a line
Visual and radar obs of strong vs. weaker convective wind events • Case: 11 August 2004 Cocoa Beach, FL • How deep is this gust front?
Visual and radar obs of strong vs. weaker convective wind events • Case: 11 August 2004 Cocoa Beach, FL • How deep is this gust front?
Summary: Severe updraft signatures • severe updraft signatures common to all storms in order of most severe first • BWER • WER • Intense reflectivity core, and deep relative to the –20° C level • Storm top displaced over WER • Deep convergence zone
Stormscale rotation • First, a review • Which is (cyclonic convergent, anticyclonic convergent, convergent, divergent)?
Mesocyclones A Rankine Combined Vortex
Mesocyclone criteria • Core diameter from • –Vmax to +Vmax should not exceed 10 km • Rotational Velocity Vr = (| –Vmax | + |Vmax |)/2 exceeds user thresholds • Persistence 10 min • Vertical continuity Vr -Vmax +Vmax
mesocyclone • Rotational velocity = (|max outbound| + |max inbound|)/2 • Use representative inbounds and outbounds, not the absolute maximum values Meso diameter = 3.5 nm Vmax = 50kt Vmin = -22kt Rotational V = 36 kt
Another classic supercell J. LaDue
Another classic J. LaDue
A diversity of mesocyclone sizes • All of these were tornadic. • Only the big one shows a meso hit G. stumpf Courtesy G. Stumpf
Summary: mesocyclones • Less than 5 nm, 10km in diameter • Persistent • Not shallow • Partly occupied by updraft and downdraft • Begins as mostly updraft then matures as downdraft forms
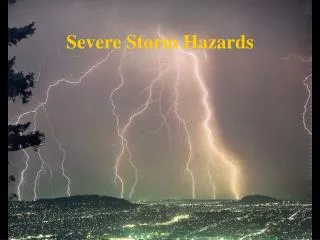
Severe weather threats • Wind • Hail • Tornado • Heavy rain
Severe wind threats • Isolated downbursts • Supercell wind threat • Organized multicell wind threat
Pulse storm downbursts The idea is to look for clues for potential downbursts before it reaches the ground. • Rapid and severe growth in updraft • Descent of the reflectivity core • Midlevel velocity convergence
Pulse storm downbursts Is this the time a warning should be issued?
Pulse storm downbursts C Doswell As an aside 300 m
Pulse storm downbursts As an aside
Pulse storm downbursts This time height trend of reflectivity shows the descending core hitting the ground just after 0006 UTC. Updraft phase
Pulse storm downbursts Updraft begins to build a core aloft 2356 UTC
Pulse storm downbursts 0002 UTC
Pulse storm downbursts Midlevel convergence signifies downdraft commencing 0008 UTC
Pulse storm downbursts 0014 UTC
Pulse storm downbursts Downdraft impacts the ground 0019 UTC
Pulse storm downbursts 0024 UTC
Pulse storm downbursts 0029 UTC
Visual and radar obs of a strong wind event • Case: 12 August 2004 Cocoa Beach, FL • Downburst precursor Mid altitude convergence is strong: A downburst precursor