Download
1 / 30
300 likes | 416 Views
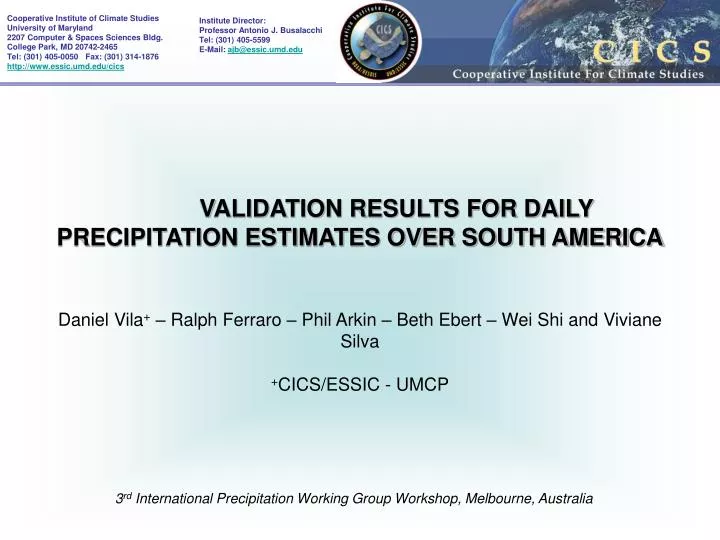
VALIDATION RESULTS FOR DAILY PRECIPITATION ESTIMATES OVER SOUTH AMERICA Daniel Vila + – Ralph Ferraro – Phil Arkin – Beth Ebert – Wei Shi and Viviane Silva + CICS/ESSIC - UMCP. 3 rd International Precipitation Working Group Workshop, Melbourne, Australia. OUTLINES

E N D
VALIDATION RESULTS FOR DAILY PRECIPITATION ESTIMATES OVER SOUTH AMERICADaniel Vila+ – Ralph Ferraro – Phil Arkin – Beth Ebert – Wei Shi and Viviane Silva+CICS/ESSIC - UMCP 3rd International Precipitation Working Group Workshop, Melbourne, Australia
OUTLINES • Something about rainfall climatology of South America • Data source of raingauge data – Frequency of observation and gridding methodology. • Statistics Parameters - Results • Case Studies • Summary and conclusions
OUTLINES • Something about rainfall climatology of South America • Data source of raingauge data – Frequency of observation and gridding methodology. • Statistics Parameters - Results • Case Studies • Summary and conclusions
Source: Willmott and Matsuura – Center for Climatic Research – Dept. of Geography – U. of Delaware
OUTLINES • Something about rainfall climatology of South America • Data source of raingauge data – Frequency of observation and gridding methodology. • Statistics Parameters - Results • Case Studies • Summary and conclusions
South American Precipitation Gridded Analysis The CPC Realtime Analysis is prepared using GTS daily reports and additional reports provided by CPTEC, INMET, FUNCEME and SIMEPAR of Brazil and INAMHI of Ecuador. Resolution: 1.0 degree x 1.0 degree Domain: 60 S - 15 N, 30 W - 90 W Window: Day 1 analysis is valid for the window from 12Z on day 0 to 12Z on day 1. Analysis Scheme: Modified Cressman (1959) Scheme (Glahn et al. 1985; Charba et al. 1992). Minimum stations for analysis: 500 for precipitation. If the number of stations is less than the minimum, then the analysis is not performed for that day. Quality Control:A. Duplicate Station CheckB. Data Check (buddy check, standard deviation check against climatology). Note:The primary sources of daily precipitation data for Brazil used in the historical gridded precipitation analyses (2005 version) are: a) Agencia Nacional de Energia Eletrica (National Agency for Electrical Energy ANEEL) (1960-1997), b) Agencia Nacional de Aguas (National Water Agency ANA) (1948-2004), c) Fundacao Cearense de Meteorologia e Recursos Hidricos (Meteorology and Hydrologic Resources Foundation of Ceara (FUNCEME) (1973-2004), d) Superintendencia do Desenvolvimento do Nordeste (Superintendence for Development of the Northeast) (SUDENE) (1948-1998), e) Departamento de Aguas e Energia Eletrica do Estado de Sao Paulo (Department of Water and Electrical Energy of Sao Paulo DAEE) (1948-1997) in collaboration with the Centro de Previsao de Tempo e Estudos Climaticos (Brazilian Weather Forecast and Climate Studies) (CPTEC), and f) Technological Institute of Parana (SIMEPAR) (1997-2004).
1 rain gauge per cell 2 rain gauges per cell 3 rain gauges per cell REAL TIME REPORTS FREQUENCY Frequency (in %) of occurrence for a given cell to be considered in the validation process.
Time series of the number of grid cells considered in this validation process for each day considering 1 rain gauge per cell. The mean observed precipitation is also plotted. Frequency (in %) of occurrence for a given cell to be considered in the validation process. Threshold value: 1 rain gauge per cell (1x1 degree)
OUTLINES • Something about rainfall climatology of South America • Data source of raingauge data – Frequency of observation and gridding methodology. • Statistics Parameters - Results • Case Studies • Summary and conclusions
ALGORITHMS • IR • HYDROESTIMATOR – Brazilian version • BLENDED (IR + PWM) • 3B40RT - 3B41RT – 3B42RT – NASA • CMORPH – CPC • PMW and GEO – NRL • PMW • MWCOMB – CPC • AMSU – NESDIS • MODELS • GFS – NCEP • NOGAPS – NRL • ETA -UMD
II I
OUTLINES • Something about rainfall climatology of South America • Data source of raingauge data – Frequency of observation and gridding methodology. • Statistics Parameters - Results • Case Studies • Summary and conclusions
SUMMARY AND CONCLUSIONS • A new real-time verification page for South America is working since May 2006 • New algorithms are welcome!!! • Rain gauge data over some regions of South America is still a big issue…→ Satellite rainfall estimation is very useful!! → but… how can users decide which algorithm works better for a given region??? • Nevertheless, real time satellite rainfall estimation data are used for many users in different regions for different purposes (agriculture, hydrology, etc.) and internet sites with this kind of information (i.e. CPTEC site) became very popular among weather enthusiast and stakeholders. • More validation work and algorithm development must be done in order to ‘regionalize’ uncertainties and to deal with the new challenges of satellite rainfall retrieval (snow, warm clouds, etc.)
SUMMARY AND CONCLUSIONS • A new real-time verification page for South America is working since May 2006 • New algorithms are welcome!!! • Rain gauge data over some regions of South America is still a big issue…→ Satellite rainfall estimation is very useful!! → but… how can users decide which algorithm works better for a given region??? • Nevertheless, real time satellite rainfall estimation data are used for many users in different regions for different purposes (agriculture, hydrology, etc.) and internet sites with this kind of information (i.e. CPTEC site) became very popular among weather enthusiast and stakeholders. • More validation work and algorithm development must be done in order to ‘regionalize’ uncertainties and to deal with the new challenges of satellite rainfall retrieval (snow, warm clouds, etc.)
SUMMARY AND CONCLUSIONS • A new real-time verification page for South America is working since May 2006 • New algorithms are welcome!!! • Rain gauge data over some regions of South America is still a big issue… Satellite rainfall estimation is very useful!! but… how can users decide which algorithm works better for a given region??? • Nevertheless, real time satellite rainfall estimation data are used for many users in different regions for different purposes (agriculture, hydrology, etc.) and internet sites with this kind of information (i.e. CPTEC site) became very popular among weather enthusiast and stakeholders. • More validation work and algorithm development must be done in order to ‘regionalize’ uncertainties and to deal with the new challenges of satellite rainfall retrieval (snow, warm clouds, etc.)
SUMMARY AND CONCLUSIONS • A new real-time verification page for South America is working since May 2006 • New algorithms are welcome!!! • Rain gauge data over some regions of South America is still a big issue…→ Satellite rainfall estimation is very useful!! → but… how can users decide which algorithm works better for a given region??? • Nevertheless, real time satellite rainfall estimation data are used for many users in different regions for different purposes (agriculture, hydrology, etc.) and internet sites with this kind of information (i.e. CPTEC site) became very popular among weather enthusiasts and stakeholders. • More validation work and algorithm development must be done in order to ‘regionalize’ uncertainties and to deal with the new challenges of satellite rainfall retrieval (snow, warm clouds, etc.)
SUMMARY AND CONCLUSIONS • A new real-time verification page for South America is working since May 2006 • New algorithms are welcome!!! • Rain gauge data over some regions of South America is still a big issue…→ Satellite rainfall estimation is very useful!! → but… how can users decide which algorithm works better for a given region??? • Nevertheless, real time satellite rainfall estimation data are used for many users in different regions for different purposes (agriculture, hydrology, etc.) and internet sites with this kind of information (i.e. CPTEC site) became very popular among weather enthusiast and stakeholders. • More validation work and algorithm development must be done in order to know uncertainties and to deal with the new challenges of satellite rainfall retrieval.