Download
1 / 2
20 likes | 146 Views
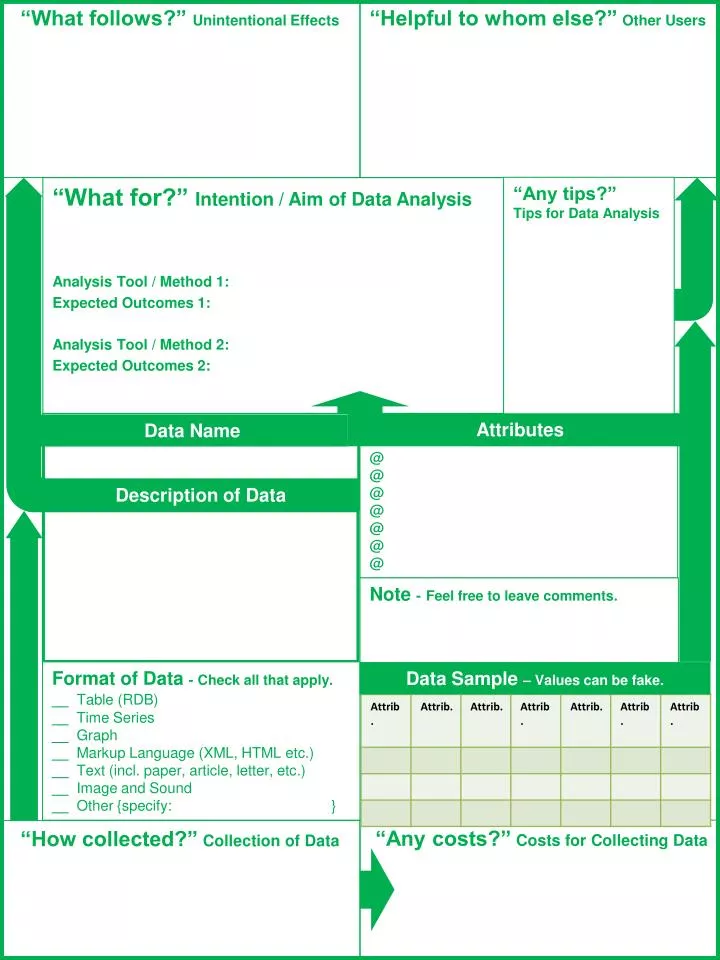
“What follows?” Unintentional Effects. “Helpful to whom else?” Other Users. “Any tips?” Tips for Data Analysis. “What for?” Intention / Aim of Data Analysis Analysis Tool / Method 1 : Expected Outcomes 1: Analysis Tool / Method 2: Expected Outcomes 2:. Attributes. Data Name. @

E N D
“What follows?” Unintentional Effects • “Helpful to whom else?”Other Users “Any tips?” Tips for Data Analysis “What for?” Intention / Aim of Data Analysis Analysis Tool / Method 1: Expected Outcomes 1: Analysis Tool / Method 2: Expected Outcomes 2: Attributes Data Name @ @ @ @ @ @ @ Description of Data Note -Feel free to leave comments. Format of Data -Check all that apply. __Table(RDB) __ Time Series __ Graph __ Markup Language (XML, HTML etc.) __ Text (incl. paper,article, letter, etc.) __ Image and Sound __ Other {specify: } Data Sample – Values can be fake. . Sample (偽で可) “Any costs?” Costs for Collecting Data “How collected?” Collection of Data
“What follows?” Unintentional Effects Noticed that there are certain areas and certain time zones where earthquake data are likely to be missing. This finding will help enhance future data collection. Also discovered the relationships between earthquakes and weather. • “Helpful to whom else?”Other Users Insurance companies are likely to be interested in this analysis. The relationships between earthquakes and weather may be interesting to meteorologists. “Any tips?” Tips for Data Analysis • “What for?” Intention / Aim of Data Analysis • Discovering hidden patterns of earthquakes • Analysis Tool / Method 1:Apriori • Expected Outcomes 1:Areas tending to quake simultaneouslyor consecutively. • Ex. Western Yamanashi prefecture ← Northern Gunma Prefecture • Analysis Tool / Method 2:Frequency analysis + ID3 • Expected Outcomes 2: Frequencybefore and after 2011 by areas • Ex. West of Aizu … Increased after 2011 Attributes Data Name Historical Data of Earthquakes @Date @Magnitude @Place @Latitude @Longitude @Depth @ Description of Data Time series data (1983.04-2013.05) of earthquakes occurring inthe Japanese islands and the near seas. Example Note -Feel free to leave comments. Format of Data -Check all that apply. ✔Table(RDB) ✔Time Series __ Graph __ Markup Language (XML, HTML etc.) ✔Text (incl. paper,article, letter, etc.) __ Image and Sound __ Other {specify: } Data Sample – Values can be fake. . Sample (偽で可) “Any costs?” Costs for Collecting Data “How collected?” Collection of Data Observed by seismometers in each area. Downloadable at the Meteorological Agency’s website.