Download
1 / 25
260 likes | 388 Views
Towards a Learning Incident Detection System. ICML 06 Workshop on Machine Learning for Surveillance and Event Detection June 29, 2006 Tomas Singliar Joint work with Dr. Milos Hauskrecht. Outline. Replace traffic engineers with ML algorithms for incident detection

E N D
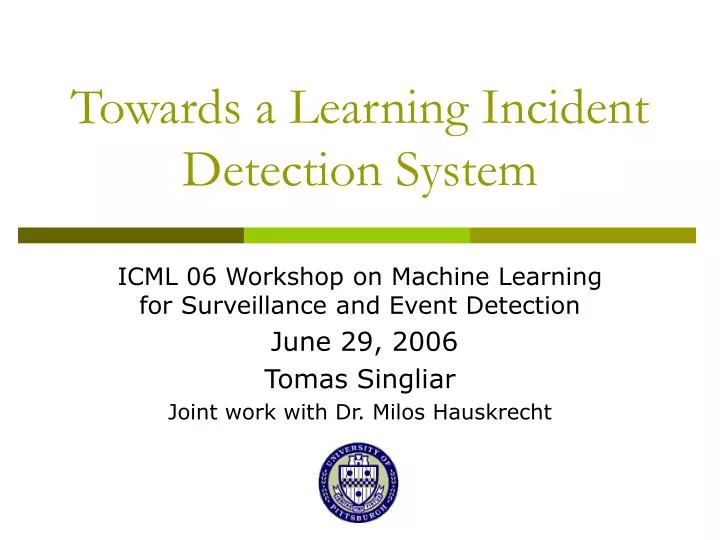
Towards a Learning Incident Detection System ICML 06 Workshop on Machine Learning for Surveillance and Event Detection June 29, 2006 Tomas Singliar Joint work with Dr. Milos Hauskrecht
Outline • Replace traffic engineers with ML algorithms for incident detection • Traffic data collection and quality • Why, who and for what purposes • Incident detection algorithms • Evaluation metrics • Individual feature performance • Sensor fusion with SVM • Noisy data problems • Attempts to model accident evolution with DBN • Conclusions and future work • Noisy data: Poor onset tagging and “bootstrap”
Traffic data collection • Sensor network • Volumes • Speeds • Occupancy • Data aggregated over 5 minutes • Incidents • police • camera system
Incident Annotation incident no incident incident
Incident annotation • Incident labels not necessarily correct or timely • Do not correct timing (opportunity for more ML )
Incident detection algorithms, intuition • Incidents detected indirectly through caused congestion • Baseline: “California 2” algorithm: • If OCC(up) – OCC(down) > T1, next step • If [OCC(up) – OCC(down)]/ OCC(up) > T2, next step • If [OCC(up) – OCC(down)]/ OCC(down) > T3, possible accident • If previous condition persists for another time step, sound alarm • Hand-calibrated T1-T3 – very labor intensive • Why so few ML applications? • nontraditional data, anomaly detection – rare positives, common sense works well Occupancy spikes Occupancy falls
Evaluation metrics • AMOC curve • Time to detection (TTD) vs False positive rate (FPR) • Don’t know when exactly incident happened • Maximal TTD (120min) • AU interesting region of C • Performance envelope • Detection rate (DR) vs FPR • Random gets over diagonal • Report ROC as a check • Sensitivity vs specificity • Low false positive region • 1 false alarm/day * 150 sensors
Features • Sensor measurements • Temporal derivative • Spatial differences
Features • Simple measurements: 3 per sensor, 6 total • Occupancy < threshold
Temporal features • Capture abrupt changes • Occupancy spike – now minus previous time slice
Spatial differences • “Discontinuities” in flow between sensor positions • Difference in speeds downstream - upstream
Sensor fusion • Information in all simple detectors • How to combine their outputs? • Linear combination – SVM
Baseline: California 2 • Hand-calibrated (+brute force) • Good low FAR performance, but poor detection rate
SVM • Combines sensor measurements via a linear combination
SVM • Spatial relations • Sensor measurements plus ratios and differences from the neighboring sensor
SVM • Temporal derivatives • Sensor measurements plus differences and ratios to previous step
Focus on low FAR • California better – persistency check
A dynamic Naïve Bayes network • Problem: Incidents are recorded later than they occur • True state of highway is unobservable by sensors • Picture of incidents evolves in time • About 30 features: 3 readings up/down stream, differences, ratios to neighboring sensor, previous time point H H … H True hidden state On On On speed … … … … O1 O1 O1 Occupancy(t-5) I I I Incident observed
H1 H2 H4 H3 A dynamic Naïve Bayes network • Evolution of an accident: • Normal traffic steady state • Accident happens, effects build up • Constricted steady state • Recovery • Model has 4 hidden states • Anchor hidden states to desired semantics: clamp p(I|H) • Raise alarm if p(H=acc_state|O) > threshold • Learned hidden state transition matrix: 0.9536 0.0332 0.0000 0.0133 0.0050 0.9577 0.0339 0.0034 0.0000 0.0882 0.9033 0.0084 0.0957 0.0000 0.0753 0.8290
DNB Performance • Poor job at low FAR • Fairly insensitive to threshold
Summary • Challenges to ML in traffic incident detection • Rare class – data sparsity, unequal misclassif cost • Incident annotations are noisy • Machine learning methods competitive though • SVM outperforms current practice • No manual tuning, readapts to data after changes • Lessons and surprises: • Richer feature sets do not help much • Neither does removing diurnal trends (?) • SVM has very stable performance • Dynamic Naïve Bayes weak
Future work • Discriminate incident and benign congestion • Improve discriminative classification • SVM with nonlinearities (?) • Unequal misclassification cost models • Improve dynamical models • SVM handles time awkwardly – Dynamic Bayes Nets • Conditional random fields – discriminative + time • Improve Data • Bootstrap – use even a strawman to label incident start, learn from relabeled data (, iterate) • Supplemental materials available • http://www.cs.pitt.edu/~tomas/papers/icml06w/ • (AMOC curves that did not fit into the paper)
Thank you • Questions? • Suggestions?
SVM • California 2 measurements • Current and past occupancies