Download
1 / 24
240 likes | 355 Views
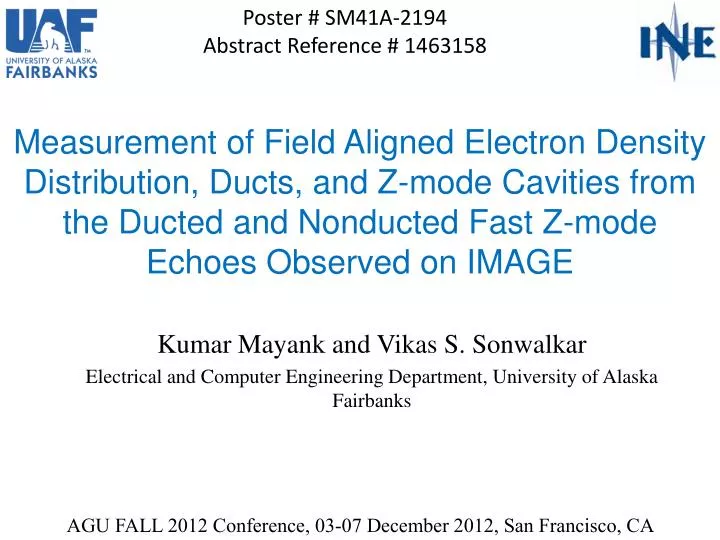
Poster # SM41A-2194 Abstract Reference # 1463158. Measurement of Field Aligned Electron Density Distribution, Ducts, and Z-mode Cavities from the Ducted and Nonducted Fast Z-mode Echoes Observed on IMAGE. Kumar Mayank and Vikas S. Sonwalkar

E N D
Poster # SM41A-2194 Abstract Reference # 1463158 Measurement of Field Aligned Electron Density Distribution, Ducts, and Z-mode Cavities from the Ducted and Nonducted Fast Z-mode Echoes Observed on IMAGE Kumar Mayank and Vikas S. Sonwalkar Electrical and Computer Engineering Department, University of Alaska Fairbanks AGU FALL 2012 Conference, 03-07 December 2012, San Francisco, CA
Abstract We present a method to measure geomagnetic field (B0) aligned electron density (Ne) distribution, ducts, and Z-mode (ZM) cavities from the ducted and nonducted fast ZM echoes observed from radio sounding at 50-1000 kHz by RPI/IMAGE. Roughly 2000 cases of fast ZM echoes have been observed on the IMAGE satellite in the altitude range of ∼800–10,000 km, invariant latitude range of 30° - 70°, and at all MLTs. In this paper we present two case studies: (1) nonducted A-B type fast ZM echoes observed on 03 Aug 2005 (L=2.59, Altitude~2350 km, MLT=4.2), and (2) ducted C-D type fast ZM echoes observed on 10 July 2001 (L = 2.68, Altitude∼4100 km, MLT = 17.7). Nonducted fast ZM A(B) trace is obtained when the ZM signal is reflected at an altitude below(above) the satellite altitude, when the satellite is within the ZM cavities, at which fZ∼ f, where fZis the ZM cutoff frequency and f is the wave frequency. From ray tracing calculations, we obtain four nonducted fast ZM echoes, each reflecting from locations where fZ∼ f. Three of the echoes retrace their paths after reflection and one forms a loop. From the inversion of tg-f dispersion we obtain the field aligned Ne distribution both above and below the satellite from an altitude of ∼1500 km–10,000 km. For ducted echoes, the ray tracing calculations show: (1) average time delay tg depends upon Ne along B0 and the shape of the ZM cavity; (2) time delay spread increases with increasing density depletion (ΔNe/Ne); and (3) the upper frequency cutoffs of various traces
depend upon both the duct width (ΔL) and density depletion (ΔNe/Ne). The measured duct has a width in range of 0.05 (105 km) ≤ ΔL ≤ 0.09 (190 km) at an altitude of ~4000 km, and L-shell=2.674, and density depletion in range of -1.5% ≤ ΔNe/Ne < -3% covering the altitude range of ~1500 km–8,000 km. Our results demonstrate that ZM echoes observed on the IMAGE satellite will provide measurements of ZM ducts at mid latitudes, and the shape of ZM cavities that will help us in determining the kind of ducts, their location and frequency of occurrence in the magnetosphere.
Figure 1. Dispersion diagram for cold plasma wave modes Fast Z : vp> c Slow Z :vp< c Z-mode cutoff frequency [Adapted from Sonwalkar et. al., 2004] (b) fpe < fce (a) fpe > fce fx fx fuh fuh fce fpe fZ fpe fce fZ f k
Figure 1. Dispersion diagram for cold plasma wave modes: The dispersion diagram for electron and proton cold plasma wave modes in coordinates of wave frequency f and wave number k. (a) Diagram for fpe>fce, a situation common in the equatorial region and plasmasphere. (b) Diagram for fpe<fce, a situation common poleward of the plasmapause [Sonwalkar et. al., 2004]. Where, fpe and fce are electron plasma- and electron gyro-frequency respectively.
Figure 2. Examples and Interpretation of nonducted and ducted fast Z-mode Echoes (a) (b) (d) (c)
Figure 2. Examples and Interpretation of nonducted and ducted fast Z-mode Echoes Example of nonducted [Fig. 3(a)] and ducted C-D type [Fig. 3(b)] fast Z-mode echoes received by RPI (Radio Plasma Imager) onboard the IMAGE satellite. Ducted traces are characterized by (1) integral relationship of echo time delays of various traces, (2) average time delays (tg), (3) multiple echoes at frequency of each trace i.e., time delay spread (Δtg), and (4) upper cutoff frequency (fuc) of various traces. 3(c),(d) Schematic shows the propagation and reflection mechanism of the nonducted and ducted Z-mode wave propagation in a cavity in a magnetic meridional plane, respectively. The nonducted Z-mode waves travel close to magnetic field line and reflect where fZ=f. The ducted Z-mode waves are confined within the duct and propagates back and forth between the two location where fZ=f.
Figure 3. Ducted Z-mode propagation in a cavity (b) (a) (c) (d) [Adapted from Carpenter et al., 2003]
Figure 3. Ducted Z-mode propagation in a cavity: (a) Plasmagram showing discrete Z-mode echoes observed on 10 July 2001. In the plasmagram, traces at different virtual ranges are observed. In each trace, multiple echoes are observed at each frequency. (b) Schematic shows the propagation and reflection mechanism of the Z mode wave propagation in a cavity. When the satellite location is inside a cavity [a minimum exhibited in Z-mode cutoff frequency (fZ) profile , shown as RfZ,min in (d), within which a narrow range of frequencies can be trapped], the Z-mode wave propagates along the magnetic field line and reflect both when traveling upward and downward. (c) different traces of discrete Z-mode echoes shown in the plasmagram, adapted from [Carpenter et al., 2003]. (d) The trace C(D) is formed when the wave propagates downward(upwards) and reflects at the location where the wave frequency (f) equals to the Z-mode cutoff frequency (fZ=f). The waves will propagate back and forth in a duct between the two location where fZ=f and forms other tracers. The time delay relation between each trace indicates the Z-mode waves propagates along the magnetic field line. CD (AB) type traces are formed when satellite is above (below) the altitude of minimum in fZ profile (RfZ,min) [Carpenter et. al., 2003].
Figure 4. Occurrence pattern of nonducted and ducted fast Z-mode echoes Non Ducted Ducted
Figure 4. Occurrence pattern of nonducted and ducted fast Z-mode echoes (a),(b) Occurrence Pattern of the nonducted and ducted fast Z-mode echoes observed by RPI/IMAGE in magnetic meridional plane respectively. ~2000 (~5% of total transmission) cases of nonductedand ducted fast Z-mode echoes have been observed in the altitude range of ~800–10,000 km, invariant latitude range of 30˚ - 70˚, and at all MLTs. About ~1000 cases are ducted echoes found inside the Z-mode cavities. About 5% of the ducted fast Z-mode echoes were reflected from the conjugate hemispheres. These last mentioned echoes were detected when the satellite was within 20˚ of geomagnetic equator. Most of the ducted fast Z-mode echoes were observed for fpe/fce ratio of 0.25-4, where fpe and fce are electron plasma- and electron gyro-frequency respectively. Field lines are plotted at L=2,4 and Concentric circle are plotted at 1000, 5000, 10,000 km altitude.
Figure 5. Case Study of nonducted fast Z-mode echoes: 03 Aug 2005 (a) Density model (c) (d) (b)
Figure 5. Case Study of nonducted fast Z-mode echoes: 03 Aug 2005 (a)Plasmagram showing the specularly reflected whistler- and nonducted fast Z-mode echoes observed on 03 Aug 2005. IMAGE was at an altitude of 2354 km, mlat=43.3˚, MLT=4.2, L=2.585. Fpe =458.9 kHz and fce=575.1 kHz. The plasmapause lies in the L-shell range of 3.77-4.09 as measured from dynamic spectra. Discrete traces of obliquely incident (OI) and normally incident (NI) specularly reflected whistler mode (SRWM) echoes [Sonwalkar et. al., 2011a] are observed in the frequency range of 20-237 kHz. Nonducted A and B traces of fast Z-mode echoes are observed between 254-326 kHz and 261.2-300.8 kHz respectively. (b)Plot of the measured and calculated time-delays for whistler and fast Z-mode echoes. The calculated time-delays are in good agreement with the observations for both whistler- and fast Z-mode echoes. (c) Plot of the electron density (Ne) and ion densities (NH,NHe,NO) along the geomagnetic field line. The Density model is in good agreement with in-situ Ne measurements from DMSP f-13 at ~850 km(within ~25%) and CHAMP at ~350 km (within ~4%), and Ne calculated from empirical models (IRI, Carpenter and Anderson 1992, and Gallagher 2000) as shown in the figure. From the inversion of tg-f dispersion we obtain the field aligned Ne distribution both above and below the satellite from an altitude of 10,000 km down to Earth Ionosphere boundary. (d) Z-mode cutoff frequency, fZ, profile along the geomagnetic field line. The fZprofile exhibits a cavity within which frequencies in the range fZ≤f≤fB,maxcan be trapped. The density model is chosen such that (i) fZ,local=fZ,sat, (ii) fZ,Eq≥fB,max.
Figure 6. Propagation of whistler- and fast Z-mode waves OI, NI: Obliquely Incident, Normally Incident WM Echo reflecting from Earth Ionosphere boundary, respectively. A: nonducted Fast ZM echo reflecting from below the satellite. B,B',B'': nonducted Fast ZM echoes reflecting from above the sat.
Figure 6. Propagation of nonducted Z-mode rays Ray tracing details of whistler and nonducted fast Z-mode echoes. Whistler mode echoes specularly reflect (SR) from the Earth Ionosphere boundary. One echo retrace its path after being normally incident (NI-SR) and other forms a loop after being obliquely incident (OI-SR) [Sonwalkar et. al., 2011]. Four nonducted fast Z-mode echoes are obtained, each reflecting from locations where fZ=f. Three of the echoes retrace their paths after reflection (A,B,B') and one forms a loop(B'').
Results of case study of 03 August 2005: • Using whistler- and nonducted fast Z-mode echoes we can remotely sense the electron density (Ne) distribution along B0 from ~10,000 km down to Earth-Ionosphere boundary. • Diffusive equilibrium density model explains the observed dispersion of whistler and non ducted fast Z-mode echoes. The model is in good agreement with in-situ Ne measurements from DMSP-f13 (within ~ 25%), CHAMP (within ~4%) and Ne from empirical models (Carpenter Anderson 1992, Gallagher 2000, IRI). • Four nonducted fast Z-mode echoes are obtained each reflecting from locations where fZ=f. Three of the echoes retrace their paths after reflection and one forms a loop.
Figure 7. Case Study of Ducted fast Z-mode echoes:10 July 2001 Density model (c) (a) fpe=509 kHz fce=301 kHz (b) (d) ΔL=105 km ΔNe/Ne=-2% 1500-7000 km
Figure 7. Case Study of Ducted fast Z-mode echoes:10 July 2001 (a) Plasmagram showing the discrete traces of ducted fast Z-mode echoes observed on 10 July 2001. IMAGE was at an altitude of 4138 km, λm= -38.3˚, MLT=17.7, L=2.68. fpe=508.6 kHz and fce=300.7 kHz. Lpp (plasmapause) measured from dynamic spectra lies in the range 5.70-5.88 L. The Z-mode cutoff frequency (fZ) at the satellite, fZ, is 380 kHz and the highest ducted frequency, fD,max, is 410 kHz. In the plasmagram, traces at different virtual ranges are observed. In each of the traces, multiple echoes were observed at each frequency. (b) The measured and calculated time delays with a duct of width 105 km, density depletion of -2% at satellite altitude on L=2.674 and extent of 1500 – 7000 km along B0. (c) Plot of electron (Ne) and ion (NH, NHe, NO) densities along B0 for the density model chosen for ray tracing analysis. The Density model is in good agreement with in-situ Ne measured from DMSP f-13 (within ~7%) and differs by a factor of 2 with CHAMP Ne measurement. (d) Plot of fZ, fpe and fce along the geomagnetic field line for the density model chosen for ray tracing analysis. The fZprofile exhibits a cavity within which frequencies in the range fZ≤f≤fD,max can be trapped. Density model is chosen such that (i) fZ,local=fZ,sat, (ii) fZ (equator) ≥fD,max. Duct parameters are chosen such that (i) average time-delays(tg), (ii) tg spread(Δtg) and upper cutoff frequencies (fuc) match with the observations.
Figure 8. Propagation of Ducted Z-mode rays (a) (b) (a),(b) Ray paths of ducted C and D traces respectively. Fast Z-mode waves can be guided along geomagnetic field lines in a density depleted duct at a range of wave normal angles. Rays injected at different wave normal angles have different travel paths [shown as travel paths aa'a'' and bb'b'' figures (a) and (b)] and therefore accumulate different time-delays. This is known as multipath propagation. This gives rise to a spread in time-delays.
Figure 9. Effects of variation of ΔL and ΔNe/Ne • The density perturbation varies along the row whereas the duct width varies along the columns. Ducts have been taken to extends to the conjugate hemisphere. If the ducts are strong enough (higher depletions) then the higher frequency (f >fZ,Equator) rays could propagate to conjugate hemisphere and return back to form echoes. Duct parameters viz., duct width (ΔL) and density perturbation (ΔNe/Ne), have following effects on the ducted echoes: • Keeping ΔNe/Ne constant, upper cutoff frequency (fuc) decreases with increasing ΔL. Average time delays (tg) and time delay spread (Δtg) have little or no effect with increasing ΔL. • Keeping ΔL constant, fucas well as Δtg increases with increasing ΔNe/Ne. Average time delay has little or no effect. The lower cutoff frequencies (flc) of all the traces are not affected at all.
Results of case study of 10 July 2001: • A density depleted ducts is required to guide fast Z-mode waves along the geomagnetic field (B0) line. • The ray tracing analysis shows that the propagation model of ducted fast Z-mode wave includes • (1) diffusive equilibrium density distribution of plasma along B0, • (2) density depleted ducts of L-shell thickness ranging between ~105 km – 190 km, and depletions of 1.5% - 3% km at satellite altitude on L-shell=2.674 covering an altitude extent of 1500 – 8000 km along B0. • Keeping ΔNe/Ne constant, fuc decreases with increasing ΔL. Average tg and Δtg have little or no effect with increasing ΔL. • Keeping ΔL constant, fuc as well as Δtg increases with increasing ΔNe/Ne. The lower cutoff frequencies (flc) of all the traces are not affected at all.
Discussion/Conclusion: • Z-mode sounding has provided a new method to measure the magnetospheric ducts in the low to mid latitude region. • A large number of Z-mode echoes in the low- to mid latitude regions on the field lines near the plasmapause are available for making field aligned irregularities (FAIs) measurement and study the FAIs in that region. • Analysis of nonducted and ducted Z-mode echoes would help us understand the propagation of waves inside the Z-mode cavities and the effectiveness of ducts in controlling the waves trapped within them. • Detailed study of the properties of ducts, and of ducted waves are important to understand the naturally occurring wave phenomenon in the magnetosphere, and the wave particle interactions.
References: Benson, R. F. (2006), Active wave experiments in space plasmas: The Z-mode, Lect. Notes Phys., 687, 3-35. Benson, R. F. (1985), Field-aligned electron density irregularities near 500 km: Equator to polar cap topside sounder observations, Radio Science, 20(3), 477-485. Carpenter D. L., et al.(2003), Z‐mode sounding within propagation “cavities” and other inner magnetospheric regions by the RPI instrument on the IMAGE satellite , J. Geophys. Res., 108, 1421. Calvert, W. (1995), Wave Ducting in Different Wave Modes, J. Geophys. Res., 100(A9), 17491-17497. Fung, S.F., and J. L. Green (2005), Modeling of field‐aligned guided echoes in the plasmasphere, J. Geophys. Res., 110, A01210. Gurnett, D. A., S. D. Shawhan, and R. R. Shaw (1983), Auroral Hiss, Z-mode Radiation, and Auroral Kilometric Radiation in the Polar Magnetosphere: DE 1 Observations, J. Geophys. Res., 88(A1), 329-340. Herring, R. N. (1980), Tracing of Z-mode rays in the magnetosphere, Journal of Atmospheric and Terrestrial Physics, 42, 885-897. James, H. G.(2006), Characteristics of field-aligned density depletions irregularities in the auroral ionosphere that duct Z- and X-mode waves, J. Geophys. Res., 111, A09315. Sonwalkar V. S., et al. (2004), Diagnostics of magnetospheric electron density and irregularities at altitudes <5000 km using whistler and Z mode echoes from radio sounding on the IMAGE satellite, J. Geophys. Res., 109, A11212. Sonwalkar, V. S., A. Reddy, and D. L. Carpenter (2011), Magnetospherically reflected, specularly reflected, and backscattered whistler mode radio‐sounder echoes observed on the IMAGE satellite: 2. Sounding of electron density, ion effective mass (meff), ion composition (H+, He+, O+), and density irregularities along the geomagnetic field line, J. Geophys. Res., 116, A11211.