Download
1 / 20
200 likes | 315 Views
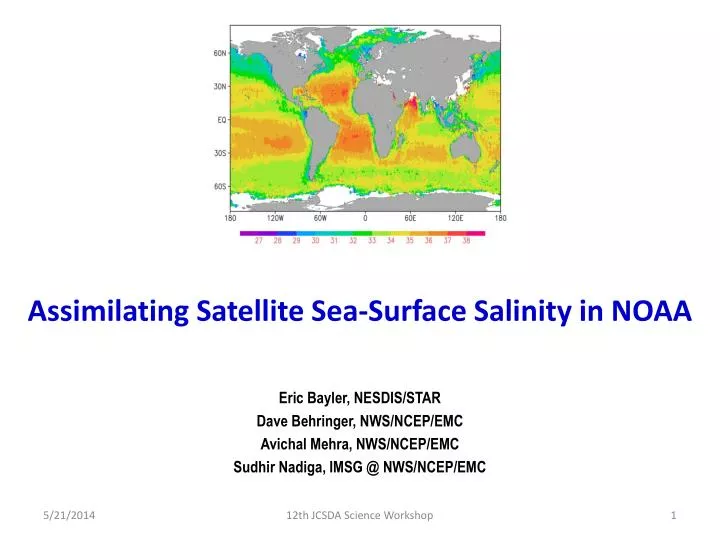
Assimilating Satellite Sea-Surface Salinity in NOAA. Eric Bayler , NESDIS/STAR Dave Behringer , NWS/NCEP/EMC Avichal Mehra , NWS/NCEP/EMC Sudhir Nadiga , IMSG @ NWS/NCEP/EMC. Sea-Surface Salinity (SSS) Data. Satellite: ESA Soil Moisture – Ocean Salinity (SMOS) mission

E N D
Assimilating Satellite Sea-Surface Salinity in NOAA Eric Bayler, NESDIS/STAR Dave Behringer, NWS/NCEP/EMC AvichalMehra, NWS/NCEP/EMC SudhirNadiga, IMSG @ NWS/NCEP/EMC 12th JCSDA Science Workshop
Sea-Surface Salinity (SSS) Data Satellite: • ESA Soil Moisture – Ocean Salinity (SMOS) mission • Barcelona Expert Centre (SMOS-BEC) Level-3 gridded SSS fields for 2012 – 2013 • Uses ECMWF modeled winds for the retrieval • 0.25-degree resolution • 3-day average (global coverage), updated every 3 days • Interpolated to model grid • NASA Aquarius mission (AQRS) • Jet Propulsion Lab (JPL) Physical Oceanography Distributed Active Archive Center (PO.DAAC) • Version 2 (V2) Level-3 gridded SSS fields for 2012 – 2013 • Uses NOAA modeled winds for the retrieval • 1.0-degree resolution • 7-day average (global coverage), updated every 7 days • Interpolated to model grid In Situ: • World Ocean Atlas (WOA) 2009 climatology • NOAA’s National Oceanographic Data Center (NODC) • 1.0-degree resolution • Interpolated to model grid • Argo profiling floats • Near-surface observations (~ 5m depth) • Monthly-mean SSS • 1.0-degree resolution • Interpolated to model grid 12th JCSDA Science Workshop
SSS Data: RMS difference of monthly means SMOS - AQRS AQRS - WOA SMOS - WOA Salinity RMS difference (psu) 12th JCSDA Science Workshop
Equatorial Pacific (2°S – 2°N) SSS: Mean WOA2009 Argo AQRS SMOS Salinity (psu) 12th JCSDA Science Workshop
Equatorial Pacific (2°S – 2°N) SSS Mean: Differences SMOS-WOA SMOS -AQRS AQRS -WOA Salinity Difference (psu) 12th JCSDA Science Workshop
Model • Modular Ocean Model v.4 (MOM4) • NOAA National Weather Service / Environmental Modeling Center (EMC) • Operational Global Ocean Data Assimilation System (GODAS) • Ocean component of NOAA’s operational Coupled Forecast System (CFS) • Near-global 1.0-degree resolution • Increased resolution (1/3-degree) between 10°S – 10°N • Forcing: NCEP Climate Forecast System Reanalysis (CFSR) • Sahaet al., 2010 • Daily fluxes • Model runs are for 2012-2013 only • Period of overlapping Aquarius and SMOS data • All runs were initiated from the same initial conditions • Relaxed to daily satellite sea-surface temperature (SST) fields. 12th JCSDA Science Workshop
Modeled Cases CONTROL • CTRL30:NODC World Ocean Atlas (WOA) monthly climatological SSS, relaxation = 30 days • Current operational configuration • CTRL10: NODC World Ocean Atlas (WOA) monthly climatological SSS, relaxation = 10 days SMOS • SMOS30: SMOS SSS, 1/4° resolution, 3-day averages (SMOS-BEC), relaxation = 30 days • SMOS10: SMOS SSS, 1/4° resolution, 3-day averages (SMOS-BEC), relaxation = 10 days Aquarius • AQ30:Aquarius V.2 daily SSS, 1° resolution (NASA/JPL PO.DAAC), relaxation = 30 days • AQ10: Aquarius V.2 daily SSS, 1° resolution (NASA/JPL PO.DAAC), relaxation = 10 days • Satellite data gaps, e.g., radio frequency interference (RFI) areas, are filled with World Ocean Atlas (WOA) 2009 monthly mean values. • All runs began from the same initial conditions. • Model forcing: CFSR daily fluxes 12th JCSDA Science Workshop
ValidationReference = Satellite Salinity Observations AQ10 RMSE; reference = AQRS SMOS10 RMSE; reference = SMOS (a) (b) Salinity RMSE (psu) Model seems to better assimilate the Aquarius data. 12th JCSDA Science Workshop
ImprovementNear-real-time Observations versus Climatology AQ10 – CTRL10; ref = AQRS obs SMOS10 – CTRL10; ref = SMOS obs (a) (b) Salinity RMSE (psu) Blue = Reduction in RMS errors 12th JCSDA Science Workshop
Validation: Altimetry SMOS10 – CTRL10 AQRS10 – CTRL10 AQRS10 – SMOS10 Normalized RMSE difference (%); reference = satellite sea-surface height anomalies SMOS10 – CTRL10 AQRS10 – CTRL10 AQRS10 – SMOS10 RMSE difference (cm); reference = satellite sea-surface height anomalies 12th JCSDA Science Workshop
Satellite SSS vs Climatology: 30-day RelaxationAverage and RMS Temperature Differences AQ30 – CTRL30 SMOS30 – CTRL30 Average Difference Average Difference Temperature Difference (°C) RMS Difference RMS Difference Red line indicates the average depth of the 20C isotherm 12th JCSDA Science Workshop
Satellite SSS vs Climatology: 30-day RelaxationAverage and RMS Salinity Differences AQ30 – CTRL30 SMOS30 – CTRL30 Average Difference Average Difference Salinity Difference (psu) RMS Difference RMS Difference Red line indicates the average depth of the 20C isotherm 12th JCSDA Science Workshop
SSS Constraint: 10-day vs 30-day RelaxationAverage and RMS Temperature Differences AQ10 – CTRL30 SMOS10 – CTRL30 Average Difference Average Difference Temperature Difference (°C) RMS Difference RMS Difference Red line indicates the average depth of the 20C isotherm 12th JCSDA Science Workshop
SSS Constraint: 10-day vs 30-day Relaxation Average and RMS Salinity Difference AQ10 – CTRL30 SMOS10 – CTRL30 Average Difference Average Difference Salinity Difference (psu) RMS Difference RMS Difference Red line indicates the average depth of the 20C isotherm 12th JCSDA Science Workshop
SSS Data vs Relaxation PeriodAverage and RMS Temperature Differences AQ10 – CTRL10 SMOS10 – CTRL10 Average Difference Average Difference Temperature Difference (°C) RMS Difference RMS Difference Red line indicates the average depth of the 20C isotherm 12th JCSDA Science Workshop
SSS Data vs Relaxation Period Average and RMS Salinity Differences AQ10 – CTRL10 SMOS10 – CTRL10 Average Difference Average Difference Salinity Difference (psu) RMS Difference RMS Difference Red line indicates the average depth of the 20C isotherm 12th JCSDA Science Workshop
Aquarius SSS vs SMOS SSS(AQ10 – SMOS10) Temperature Difference Salinity Difference Average Difference Average Difference RMS Difference RMS Difference Red line indicates the average depth of the 20C isotherm 12th JCSDA Science Workshop
Latitudinal Differences 5-degree-wide Longitudinal Slice at 120° W: Temperature AQ10 – CTRL10: Avg Difference SMOS10 – CTRL10: Avg Difference AQ10 – CTRL10: RMS Difference SMOS10 – CTRL10: RMS Difference Temperature Difference (°C) Red line indicates the average depth of the 20C isotherm 12th JCSDA Science Workshop
Latitudinal Differences5-degree-wide Longitudinal Slice at 120° W: Salinity AQ10 – CTRL10: Avg Difference SMOS10 – CTRL10: Avg Difference AQ10 – CTRL10: RMS Difference SMOS10 – CTRL10: RMS Difference Salinity Difference (psu) Red line indicates the average depth of the 20C isotherm 12th JCSDA Science Workshop
Summary • Assimilating satellite SSS fields improve the simulated ocean state, thus will provide better initialization of coupled seasonal and tropical cyclone forecast systems. • Significant commonalities in results when using two independent satellite SSS data sets demonstrate the robustness of the results • Improvements accrue from using satellite SSS data, as well as shortening the salinity relaxation period • Most temperature and salinity differences at or above the 20° isotherm • Generally more intense impact with respect to the current operational configuration (SSS monthly climatology) when using Aquarius data. • Results indicate largest differences/improvements in the tropical Pacific Ocean. • Possible improvement in countering the model’s tendency toward mirroring the ITCZ in the Southern Hemisphere. • Validation • Sea-surface height error reduction indicates some improvement in this region • No obvious impact on ocean heat content other than a very faint indication of improvement in the tropical Pacific (figure not shown) • Next: • Examination of model response in the Atlantic and Indian Oceans • Assimilation of SSS Level-2 data 12th JCSDA Science Workshop