Download

1 / 43
430 likes | 515 Views
Seven (plus or minus two) Clusters, A Monte Carlo Study. Larry Hoyle, Policy Research Institute, The University of Kansas. 1972 Kansas Statistical Abstract. 30 Years Ago. Shading by Overprinting. Shading by Line Spacing. 20 Years Ago. Line Shading Detail.

E N D
Seven (plus or minus two) Clusters,A Monte Carlo Study Larry Hoyle, Policy Research Institute, The University of Kansas
1972 Kansas Statistical Abstract 30 Years Ago
Shading by Line Spacing 20 Years Ago
What did they have in common? • Neither method is “continuous” • So both methods required grouping or classes Fixed number of combinations Characters on a fixed grid Integer number of lines in the polygon Lines are relatively coarse
How to Group for Shading • Equal Intervals • Equal numbers (quantiles) • By clusters • Don’t group (unclassed)
Population Density – 7 Equal Intervals 100 counties fall into the bottom class
Population Density - Equal Numbers 15 counties in each class - a very different picture
Population Density - Cluster Means Group around the 7 values that “best” represent the data
Population Density - Unclassed No classes, just shade in proportion to value
Clustering • Tries for “Best” grouping • Each member of cluster can be represented by the mean of the group
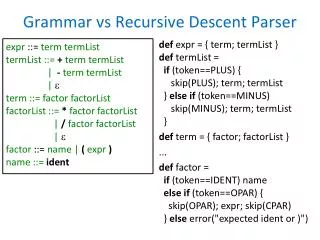
Proc Fastclus • You specify the number of clusters • Minimizes cluster sum of squared distance (e.g. minimum within cluster variance) • inspired by: – k-means (MacQueen) leader algorithm (Hartigan)
4 clusters y . data cluster R-squared=.9912 0 10 20 30 40 50 60 70 80 90 x
4 clusters data Correlation .9956 R-squared=.9912
3 clusters y . data cluster R-squared=.9609 0 10 20 30 40 50 60 70 80 90 x
Plot R-squared by number of clusters Sample of 300 observations, Uniform distribution, 11 cluster analyses
What happens if there really aren’t any clusters?Let’s try 500 samples
Uniform, 300 obs. per sample 500 samples, 11 clusterings each
Uniform, 1000 obs. per sample 500 samples, 11 clusterings each
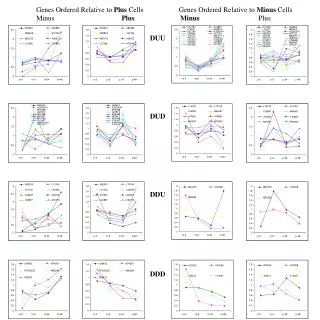
Normal, 300 obs. per sample 500 samples, 11 clusterings each
Normal, 1000 obs. per sample 500 samples, 11 clusterings each
Exponential, 300 obs. per sample 500 samples, 11 clusterings each
Exponential, 1000 obs. per sample 500 samples, 11 clusterings each
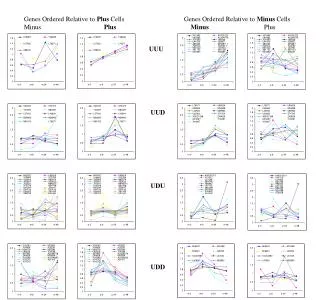
Uniform, 72 500 samples, 11 clusterings each
Normal, 72 500 samples, 11 clusterings each
Exponential, 72 500 samples, 11 clusterings each
Minimum R squared by sample size and distribution At least 95% of the variance for all
Histograms • Equal intervals • Number of observations in each interval
The Magical Number Seven, Plus or Minus Two: Some Limits on our Capacity for Information Processing George Miller, The Psychological Review1956, vol.63 pp. 81-97
Limits on Categories for Absolute Judgments • Pitch 6 • Loudness 5 • Visual position 9 • Size of a square 5 • Hue 8 Name the colors in this slide
“And finally, what about the magical number seven?” George A. Miller
Miller – Quote 1 “What about the • seven wonders of the world • seven seas • seven deadly sins • seven daughters of Atlas in the Pleiades • seven ages of man • seven levels of hell • seven primary colors • seven notes of the musical scale • seven days of the week”
Miller – Quote 2 “What about the • seven-point rating scale • seven categories for absolute judgment • seven objects in the span of attention • seven digits in the span of immediate memory”
Miller – Quote 3 “…Perhaps there is something deep and profound behind all these sevens, something just calling out for us to discover it.”
Miller - close “But I suspect that it is only a pernicious, Pythagorean coincidence.”
Coincidence or Nature’s Parsimony? Does our capacity match what’s needed for 95% of the variance? 95%? Hmmmm……. Larry Hoyle Policy Research Institute University of Kansas LarryHoyle@ku.edu confidence intervals an A 19 fingers and toes 970,000 web pages


![Element 2 Technician Class Question Pool T2 Operating Procedures [3 Exam Questions – 3 Groups]](https://cdn1.slideserve.com/3359810/element-2-technician-class-question-pool-t2-operating-procedures-3-exam-questions-3-groups-dt.jpg)