Download
1 / 20
200 likes | 328 Views
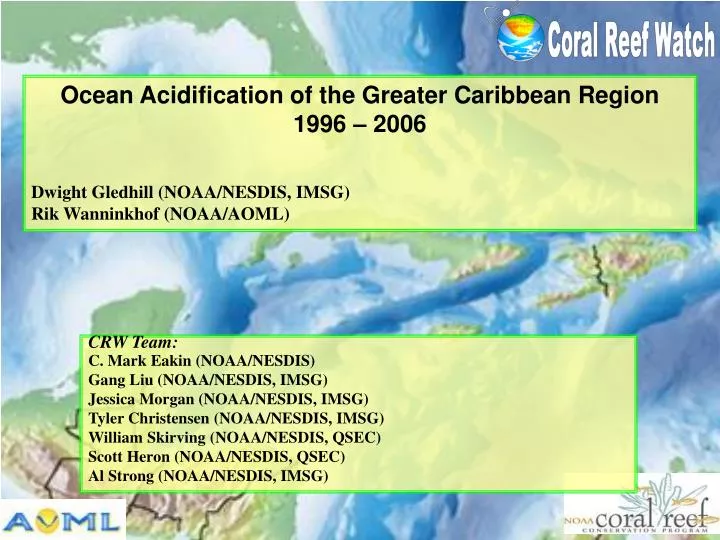
Ocean Acidification of the Greater Caribbean Region 1996 – 2006 Dwight Gledhill (NOAA/NESDIS, IMSG) Rik Wanninkhof (NOAA/AOML). CRW Team: C. Mark Eakin (NOAA/NESDIS) Gang Liu (NOAA/NESDIS, IMSG) Jessica Morgan (NOAA/NESDIS, IMSG) Tyler Christensen (NOAA/NESDIS, IMSG)

E N D
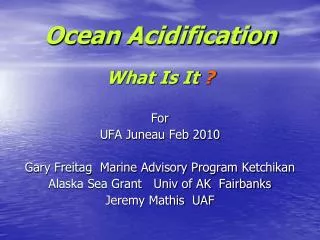
Ocean Acidification of the Greater Caribbean Region 1996 – 2006 Dwight Gledhill (NOAA/NESDIS, IMSG) Rik Wanninkhof (NOAA/AOML) CRW Team: C. Mark Eakin (NOAA/NESDIS) Gang Liu (NOAA/NESDIS, IMSG) Jessica Morgan (NOAA/NESDIS, IMSG) Tyler Christensen (NOAA/NESDIS, IMSG) William Skirving (NOAA/NESDIS, QSEC) Scott Heron (NOAA/NESDIS, QSEC) Al Strong (NOAA/NESDIS, IMSG)
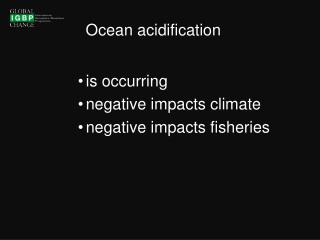
Ocean Acidification of the Greater Caribbean Region 1996 – 2006 • Ocean Acidification 101 • Modeling Greater Caribbean Region (GCR) Sea Surface Carbonate Chemistry • Changes in GCR surface chemistry over the past decade • Caveat's & Gaps
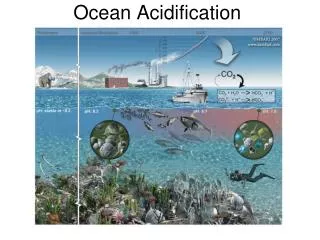
Ocean Acidification pH W CO32- phase Saturation State [ ] [ ] + - 2 2 CO2(aq) Ca CO 3 = CO2 * K sp , phase W > = 1 precipitation W = = 1 equilibrium www.niwascience W < = 1 dissolution Wolf-Gladrow et al., 1999 ≈ 48% of anthropogenic CO2 taken up by the ocean
Ocean Acidification W phase Saturation State [ ] [ ] + - 2 2 Ca CO 3 = * K sp , phase W > = 1 precipitation W = = 1 equilibrium W < = 1 dissolution
Project Objectives • Derive changes in Greater Caribbean Region sea surface arg over the past decade (1996-2006) • Requirement: • Estimate pCO2,sw • Estimate Alkalinity • Solve for carbonate system
Carbon Dioxide Partial Pressure (pCO2,sw) NOAA/CMDL Carbon Cycle Greenhouse Gasses (CCGG) Group flask sampling program. - Underway SST, SSS, pCO2
Total Alkalinity (TA) Alkalinity fields for the GCR used the Lee et al. (2006) equation for (sub)tropical waters.
Daily mean sea level pressure (SLP) NOAA-CIRES Climate Diagnostics Center Monthly sea surface salinity climatologies of NODC (Levitus) World Ocean Atlas Surface TA & pCO2,sw Maps NOAA Optimum Interpolation 1/4 Degree Daily Sea Surface Temperature Analysis NODC_WOA94 data provided by the NOAA/OAR/ESRL PSD, Boulder, Colorado, USA, from their Web site at http://www.cdc.noaa.gov/
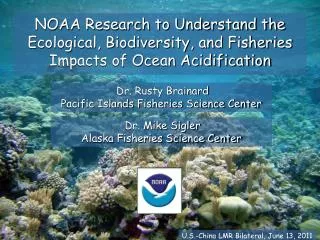
> 4.0 % of Region • Seasonal Variability ~ 5 - 10% • Entire GCR ‘Marginal’ in Winter by 2004 • % of Region > 4.0 Declines Sharply
A B D C > 4.0 % of Region • Seasonal Variability ~ 5 - 10% • Entire GCR ‘Marginal’ in Winter by 2004 • % of Region > 4.0 Declines Sharply
A B D C ~0.15±0.02/decade Kleypas et al., 1999 Annual Mean below Critical A – 2056 B – 2072 C – 2084 D – 2089 Annual Min below Critical A – 2022 B – 2042 C – 2062 D – 2085 -0.11±0.02/decade CRITICAL LEVEL
NASA Aquarius; validated HYCOM salinity TA survey of GCR Improved Caribbean Sea Coverage Coupled CO2-system parameters (pCO2,sw, TA, pH, DIC) Improved algorithm parameterization (biological, air-sea gas exchange, mixed layer) Increased VOS coverage in coral reef regions Oceanic & Coastal (Reef) Observations Caveats & Gaps CONCERN: NEED: • Salinity poorly constrained in the GCR • TA algorithm not validated for the GCR • pCO2,sw not adequately parameterized • Application to other regions (e.g. NWHI) • Waters overlying reef systems exhibit lower and high variability
Summary & Final Remarks • Ocean acidification in the GCR is occurring at rates consistent with current model predictions • Current arg levels are adequate/marginal • However, at current OA rates, parts of the GCR will reach critical levels this century • Coupled satellite & in situ observations can be applied to track OA • Demand for improved CO2-system observations
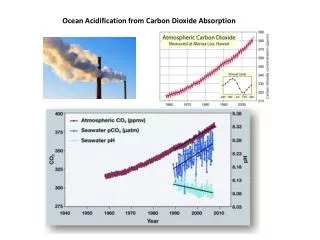
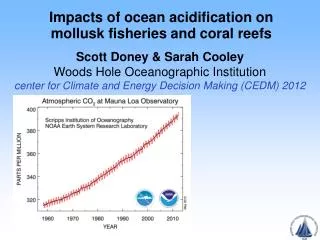
Changing Surface Ocean Chemistry NOAA CMDL CCGG CO2 data at Mauna Loa, HI Derived surface (50 m) values obtained using on-line data available at http://hahana.soest.hawaii.edu/hot/hot-dogs/ and solved using the Lewis E. and Wallace D.W.R. (1998) Basic program for CO2 system in seawater. ORNL/CDIAC-105, Oak Ridge National Lab
Simple pCO2,sw algorithm derived for the GCR usingmultivariant regression analysis (Wanninkhof et al., 2007 ) 2002: pCO2sw =10.18 SST+ 0.5249 lat - 0.2921 lon + 52.19, n = 40204, rms = 5.7 µatm, r2= 0.87 2003: pCO2sw =10.45 SST+ 0.3629 lat - 0.5144 lon + 36.52, n = 60373, rms = 5.9 µatm, r2 =0.92 2004: pCO2sw =10.64 * SST + 0.9745 * lat - 0.3687 * lon + 30.68, n = 86695, rms = 7 µatm, r2 = 0.85 • Drift in algorithm • Hind-cast of last year! • Lat & Lon dependence Wanninkhof et al., 2007 Box plots of residuals between pCO2 determined from remotely sensed SST data and bin-averaged pCO2 data from the Explorer.
Projected Changes in Reef Calcification IPCC IS92a ‘business-as-usual’ • NW Hawaiian Islands calcification • 1765 Adequate • 2000 Marginal • 2100 Low Calcification rates in the tropics may decrease by 30% over the next century After Feely et al. (in press) with Modeled Saturation Levels from Orr et al .(2005)