Download
1 / 42
420 likes | 497 Views
The 2009 Faulkner County Economic Report. 59 th Annual Report. Dr Pat Cantrell. Dean of the college of Business. Giezi Nunez Intern UCA Economics Major Amber Hall Project Specialist Office of Institutional Research. From. Cotton. To. Computers.

E N D
The 2009 Faulkner County Economic Report 59thAnnual Report
Dr Pat Cantrell Dean of the college of Business
Giezi Nunez Intern UCA Economics Major Amber Hall Project Specialist Office of Institutional Research
From Cotton To Computers
1910 Between 14 and 20 Cotton Gins in the County Estimated 33,000 Acres of Cotton Planted 15,130 Bales of Cotton Produced Sale Price Between $75 and $100 per Bale Value of Production Between $1.0 and $1.5 Million
Gross Domestic ProductPercent Increase over Previous Year 4.5 4.2 3.7 3.6 2.8 2.5 2.3 2.0 1.6 1.3 0.8 -2.4 1998 1999 2000 2001 2002 2003 2004 2005 2006 2007 2008 2009
Unemployment Rate 9.3% 6.0% 5.8% 5.8% 5.5% 5.1% 4.9% 4.7% 4.6% 4.6% 4.5% 4.2% 4.0% 1997 1998 1999 2000 2001 2002 2003 2004 2005 2006 2007 2008 2009
Consumer Price Index (CPI) 3.8% 3.4% 3.4% 3.2% 2.8% 2.8% 2.7% 2.3% 2.2% 1.6% 1.6% -0.4% 1998 1999 2000 2001 2002 2003 2004 2005 2006 2007 2008 2009
CPI for All Urban Consumers(Seasonally Adjusted) 2008 2009 -18.4 Energy 13.9 3.2 Medical Care 3.7 1.9 Food 5.4 Other Goods & Services 6.7 3.6 0.4 Housing 3.2 3.0 Education & Communications 3.4 -8.3 Transportation 5.9 Recreation 0.9 1.6 -0.1 1.0 Apparel All Items 3.8 -0.4
Family Units Constructed 1532 1133 933 735 760 602 448
Value of Building Permits (In Million Dollars) 199 159 146 141 141 136 120 104 98 87 2000 2001 2002 2003 2004 2005 2006 2007 2008 2009
Faulkner County Real Estate Sales(In Million of Dollars) 529 504 489 432 348 347 312 278 262 257 221 1999 2000 2001 2002 2003 2004 2005 2006 2007 2008 2009
Conway CorporationRevenues, Capital Expenditures and Number of Customers
Faulkner County Sales Tax Collections Conway Sales Tax Collections
Estimated Retail Sales for 2010 Conway $1,190,000,577 Faulkner County $1,546,338,200 77% of all Faulkner County Sales Occur in Conway
Conway Advertising and Promotion Tax2% of Hotel and Restaurant Sales 2008 2009 % Change Hotels $349,719 $318,502 -7.1% Restaurant $2,466,032 $2,573,883 +5.4%
Hotel Sales 2008 2009 % Change $17,485,927 $16,248,312 -7.1%
Top Five Hotels by Annual Sales 1. 4. 3. $2,155,681 $1,433,577 2. 5. $1,434,821 $1,609,802 $1,119,822
Restaurant Sales 2008 2009 % Change $124,115,600 $130,787,393 +5.4%
Top Ten Restaurant by Annual Sales 1. 3. 2. Salem $3,694,423 $3,272,989 $3,317,167 4. 6. 5. Oak Street $2,758,667 $3,208,238 $2,538,645 7. 8. 9. Hwy. 65 N. $2,498,141 $2,441,970 $2,515,258 10. $2,316,654
Number of Banking Institutions in Faulkner County and Total Deposits
Bank Earnings of Institutions Represented in Faulkner County (Year to Date as of June 30)
Faulkner County Motor Vehicle Registration 86,889 84,392 80,745 75,291 78,677 75,869 66,182 70,703 68,269 64,775 51,116 39,001 1990 1995 2000 2001 2002 2003 2004 2005 2006 2007 2008 2009
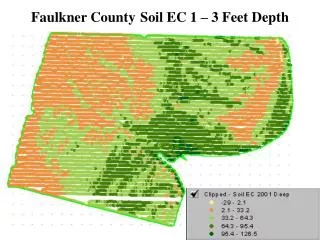
Lifetime Production of Wells byCounty as of September 30, 2009
Fayetteville Shale Production 2009 Monthly Production and Estimated Value