Download
1 / 51
510 likes | 763 Views
A study on the water quality of Austwick beck. By Alec Christie. Aim.

E N D
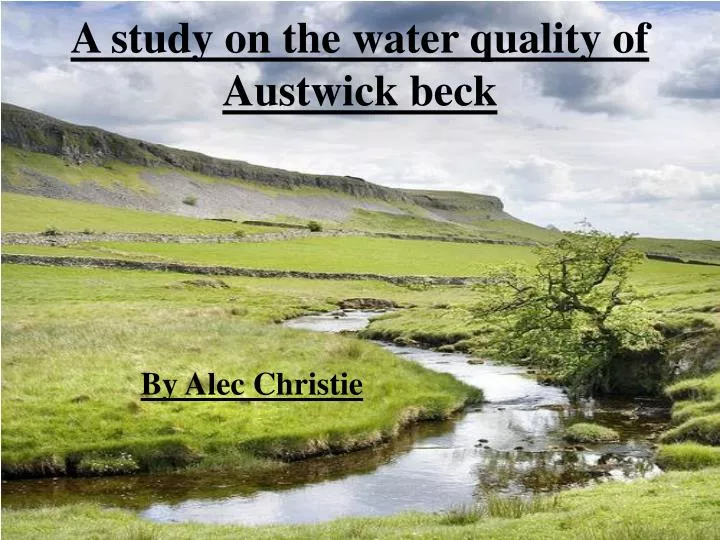
A study on the water quality of Austwick beck By Alec Christie
Aim In the main investigation of this project, I hope to explore how the water quality of Austwick beck in North Yorkshire varies along its course at sites I have located to test the water, 1, 2, 3 and 4; I will be also be looking into what (if any) effects the weather has on the results of water quality of the beck, as a further investigation done only on site 3. There are four different factors that I will use to help determine the quality of the water in Austwick beck, they include: • The Turbidity • The Temperature of the water • The levels of dissolved oxygen • And the pH of the water (the acidity or alkalinity) I will now explain the meanings of these four variables and why they are vital for supporting life, over the next few pages.
The Turbidity The Turbidity is the how we measure the clarity of the water, showing the amount of material, including dead matter, waste, the load that the beck carries in suspension and the amount of algae; all of which can have different effects on the river’s precious ecosystem and other aspects of the river that have connections and consequences with and on the environment around it. For example, if the water clarity is very poor there will be less sunlight able to penetrate through to the oxygenating plants that need it to fuel photosynthesis, which provides oxygen for organisms that live in the water, which in turn feed or are needed by organisms higher up the food chain and in and out of the water. As you can see the Turbidity of the water is imperative for ecosystems to function properly and for food chains to remain intact.
The Temperature Many aquatic animals are extremely sensitive to changes in temperature. They are used to natural changes in the temperature, for instance, when the sun is at its highest in the day, organisms are able to cope with the extra heat and also when it is night, they can survive the colder conditions. It is changes in the range of temperatures that can be catastrophic for life in the river; if the temperature is over or under the specific levels for sustaining life for a long period of time, then many animals like fish become stressed and die, many will leave and plants will stop producing oxygen, killing the few remaining creatures that are left. Of course the temperature range of river’s vary from place to place and in different seasons, for which most the animals that live in them are adapted to. However, with urbanisation increasing, more and more factories, houses and other buildings that release warm water, toxic waste and dirty water are contributing to unnatural temperature fluctuations, endangering the ecosystem and animals that live within it.
The Saturation of Dissolved oxygen The amounts of dissolved oxygen in rivers is extremely important to keeping the ecosystems within them healthy. Of course, all aquatic animals need oxygen to live and so without enough dissolved oxygen in the water, most of life would inevitably die. Many natural and human implications can cause the availability of dissolved oxygen to change, endangering the ecosystems that rely on it. When measuring dissolved oxygen, the main readings are ppm, parts per million or ppt, parts per thousand but it can sometimes shown as a percentage of saturation and this changes with the temperature of the water. For example, if the water is cold at 8 degrees Celsius, then the river may be able to hold up to 12 ppm (parts per million) of oxygen before it is saturated at 100%; but if the water is at 28 C, the water will become 100% saturated at 8 ppm – a smaller amount of oxygen. So, as you can see, cold water can hold more oxygen that warm water. Fluctuations in the amount of dissolved oxygen can endanger plants and animals abilities to thrive in rivers, which could have repercussions back along the food chain and ecosystem. High levels of bacteria and large amounts of rotting material can cause these adverse affects and of course when the temperature fluctuates due to natural or unnatural causes, as was explained on the last page, the dissolved oxygen will too because not only does this reduce the amount of oxygen that can be stored by the water before it is fully saturated but also impacts on the producers of oxygen, the plants, and if they start dying and do not produce enough oxygen to keep other organisms alive, then the whole ecosystem breaks down and dies too.
The pH (the acidic or basic quality of the water) Short for the potential of Hydrogen, the measurement of the pH of the water is based on a scale from 0 to 14. Any reading below 7 is acidic (0 being extremely acidic) and anything above 7 is alkaline (being extremely basic), with 7 being neutral. Animals living in river’s are adapted to the pH of the river, and changes in this can be extremely detrimental to all life in the river. First of all, the average healthy pH range for aquatic animals to survive in is from 6.5 (being slightly acidic) to 8.0 (being slightly alkaline – or basic). If the pH changes, animals can stop reproducing, move away from the area and of course, die. Changes in this can be brought about by many things, such as: acid rain (atmospheric deposition), wastewater discharges and drainage from mines.
Introduction to Austwick beck Austwick beck is situated in the Yorkshire dales, in north-west England and runs through to the river Wenning which in turn flows into the river Lune.
This is a map of the course of Austwick beck. It travels from the high ground at the first test site, down through farmland and a few rapids to the village of Austwick, where I live.
The beck starts off out of a cave at the head of the beck, just before the first test site. Here it travels relatively smoothly through marshy/bog-like farmland (with livestock and no tree cover), to the second test site. Austwick beck head
When the second test site is reached, the gradient increases slightly and there is a miniature waterfall with rapids where it descends a little faster. Here there is access for animals and people and no tree cover.
There is a large gap between the 2nd and 3rd test site where the river isn’t accessible. And midway between the two sites the beck levels out and starts to meander after the 3rd test site through where there are some small rapids too. Most of the way along from where the beck planes out, there are a lot of opportunities for livestock to access the stream – something that will be of importance later on. The 3rd test site has a lot of tree cover and there is access for people and animals too.
At the 4th and last test site, the stream runs under a bridge after passing through some tree cover and land with livestock in. The actual test site has a little tree cover and is also accessible to people and animals. This is where I decided to stop following the course of the river, from here the beck runs into the river Wenning, joining at a confluence with two other becks’, Fen beck and Clapham beck. The river Wenning eventually goes onto flow into the river Lune, which makes Austwick beck a tributary of a tributary of the river Lune.
Theories: The Turbidity Turbidity varies from place to place in rivers and can be caused by many different factors. For example: areas that have higher amounts of livestock, people and other animals that are able to access the river, should have lower levels of clarity as the intrusion of animals and people will: stir up the bed load of the river, leave faeces behind and drop material from elsewhere into the river. All this can cause the levels of turbidity to rise and of course, the type of weather present will also have an effect; most likely to be that if there is rain and wind there will be more material stirred up by higher flows of water and more material deposited in the water by the wind (leaves, branches, etc.) and in sunny, calm conditions there will be a high clarity of water as there will be little to disturb the bed load or cloud the water with other materials. Low levels of turbidity are needed to support life; too much and plants stop producing oxygen by way of photosynthesis as the area that sunlight can penetrate is reduced suffocating animals. In many cases rotting plants that cause some of the turbidity also increases the temperature of the water, which again has an impact on the amount of oxygen available and drives away aquatic animals which cannot adapt to the changes in the temperature.
Temperature The temperature of the water will of course will vary in different weather conditions and according to the time of day. The water will normally be naturally cooler in the morning and at night than at midday and in the afternoon; it will also be naturally cooler in the rain and wind than in the sun because the air temperature will become cooler in wet and cold weather and warmer in dry, sunny conditions. The humidity of the day will also change the temperature of the air and in turn that of the water, so the amount of cloud cover will also affect the temperature too. The amount of tree cover providing shade will also have an effect on the temperature of the water because the more shade and tree cover there is, the less heat there will be to warm the water and the lower the temperature of the water will be. Another factor is the amount of livestock nearby that have access to the water. More faeces will be produced and left to decay in the river as well as other decaying material such as plants and dead bodies of animals which may warm up the water. Factories and towns nearby may also have effects as drains, warm water discharges and other flows of water into rivers may lower or increase the temperature. Organisms rely on stability of natural temperature ranges that they have adapted to, to survive. If temperatures fluctuate too much, the amount of dissolved oxygen will decrease and will kill animals.
Dissolved oxygen Higher levels of dissolved oxygen will normally be found by rapids or waterfalls where there are larger amounts of ‘white water’ where air bubbles enter the water’s surface and therefore increase the levels of oxygen present. However, areas of marsh and bog-land, the amount of dissolved oxygen found in the water there is naturally lower because there is naturally more decaying material (which is really micro-organisms feeding on dead material and because there is more dead material to be eaten and cleared away by them, they need more oxygen to do this, using up more oxygen and lowering the levels of it in the water in the process). Plants are the main sources of dissolved oxygen and when they photosynthesis, more oxygen is produced. However the amount of plants that can photosynthesis changes due to other factors including: the turbidity (the clearer, the more light for plants to produce oxygen), the temperature (higher temperature, normally more sunlight, more photosynthesis) and also the amount of toxic chemicals in the water (more waste, kills more plants, less oxygen from less plants). But of course dissolved oxygen can vary because it has a direct link with the temperature of the water so it will rise and fall in accordance. If the temperature is low then the amount of dissolved oxygen that can be dissolved below the saturation level will increase but when it warms up, the saturation level will be lowered and thus less oxygen will be dissolved, no matter if more plants are photosynthesising. Higher levels of dissolved oxygen mean more oxygen for organisms to survive on.
pH The natural pH of a river is normally between 6.5 – 8.0 on the scale of 0-14. This is the range that fish and other aquatic organisms prefer to live in. Any higher (more alkaline) or lower (more acidic) and the ecosystem will break down. This has been seen in many areas of Scandinavia where acid rain (atmospheric deposition coming over from the U.K and other countries) is decreasing the pH of the water in lakes, making it more acidic and this is killing thousands of fish. Towns and villages can also be affect the pH of river by releasing wastewater from factories and drains in mines. So a balanced pH between 6.5 and 8.0 is essential for supporting life in rivers.
Hypotheses for water quality on test sites 1, 2, 3 and 4 The Turbidity: I would expect to find higher levels of turbidity from samples in test sites 1 and 4 whereas I would expect that test sites 2 and 3 would have slightly lower levels (higher clarity). This is because sites 1 and 4 are nearest to places where animals are likely to enter the water and excrete waste, stir up some of the bed load, maybe trample in some material from the banks of the river and also deposit materials they have picked up on their body from elsewhere, thus reducing the clarity of the water. However in site 3 there is no area for livestock to enter the water – there is access for people and other animals such as dogs and horses to enter, but they can only enter at least five or six metres down stream from the actual testing area so the next site downstream (site 4) is likely to pick up the material instead.
The same goes for site 2 where livestock cannot enter, here however people and other animals can enter the water upstream from the test area, although I doubt that this will have much of an effect on the overall turbidity as most of the material that is deposited in the process will probably be left on the rocks forming the miniature waterfall/rapids. Therefore I predict that the turbidity will be higher in places where livestock have the most access to the specific site; livestock has the most access to the stream at the start and finish of the stream section that I am testing, so sites 1 and 4 (nearest in terms of being downstream to livestock ‘hotspots’) should have higher turbidity. Site 4 has livestock grazing up stream so it will therefore have a higher turbidity than site 3 which is relatively free of livestock and other animals Site 4 Site 3
The Temperature The temperature of the water will vary but will probably be generally low as the climate at this time of year for northern England is quite cold. Like I stated in the last paragraph, the amount of waste excreted by livestock on farmland may have an effect on some of the tests, in this case I would expect it to increase the temperature of samples from sites 1 and 4 slightly because they are the sites nearest (downstream) to where animals are likely to excrete waste – which is going to increase the water because it has a higher temperature than the water itself. There have been quite a few sightings of fish and other cold-blooded animals in the river which indicates that the water is cold enough for them to live in. There have also been sighting of birds such as kingfishers, herons and dippers which feed on organisms in rivers. This indicates that the temperature of the water is the cold enough (but not too cold) to be able to support cold-blooded life and also plant life too as each part of the food chain must be functioning properly if all the organisms within it are healthy. The area around sites 3 and 4 (refer back to the maps in the introduction), are quite overgrown and shrouded by trees and plants; this will cut off sunlight from heating the river but may also cause a higher humidity if it is already cloudy but mild – so the effects that this may have on the temperature of the water are debatable as it all depends on the type of weather present. However on sites 1 and 2 it is quite easy to predict whether the temperature will be higher or lower in hot or cold weather because they are open and un-shaded; this means that if the weather is warm and sunny, the water may be warmer, if it is cold and cloudy, then the water may be cooler. Therefore, taking everything into account, I predict that the temperature of the water from sites 1 and 2 will be warmer than water from sites 3 and 4, that is, in warm weather. However, in cooler weather, I would not expect there to be a large difference in temperatures because the waste excreted by animals may level out the range of temperatures increasing site 1 and 4’s temperatures but leaving site 2 and 3’s around the same. The weather on the day of the tests will ultimately decide whether the temperature will be higher or lower but generally as I said, I would expect the weather to be cool as the climate is generally at this time of the year, so I would expect little, if any, difference in the temperatures of the water samples from different sites.
Dissolved oxygen The amount of dissolved oxygen will probably be reasonably high for all sites because it’s getting quite cold up hills of the dales now it’s getting into autumn because cooler water holds more oxygen than warm water does. On the other hand, the days are getting shorter with less sunlight so there is less time for plants to photosynthesis, which also means that there is also less time for oxygen to be produced by the oxygenating plants in the beck which will the lower the amount of dissolved oxygen in the water even though the capacity that cold water can hold is high. However I suppose because the high ground nearer the head of the beck is more bog-like that it will have naturally low levels of dissolved oxygen than the ground lower down in the valley because of the naturally higher amounts of decaying matter including faeces from the livestock. However, there is quite a lot of livestock on the lower levels too, which may also lower the amount of dissolved oxygen in those places, not only by introducing more decaying matter but also by heating up the river slightly by excreting waste which is warmer than the water’s temperature. The waste from livestock may also encourage algae to bloom, which may absorb most of the oxygen and cut off light for plants – slowing down the process of photosynthesis or stopping it in some places – which will lower amount of dissolved oxygen being produced and kept in the water. Site 4 Livestock producing faeces, contributing to higher turbidity and decreasing the amount of dissolved oxygen Algae encouraged to bloom by waste from Livestock, which then uses up oxygen
Dissolved oxygen continued: I would expect to find higher levels of dissolved oxygen in the parts of the river where there are waterfalls or rapids as the water there will be travelling faster than in the other places in the river. This will mean the air particles hitting the water will be hitting it with much more force than normal (producing the noticeable ‘white water’ where the air bubbles are travelling into the water because the water particles are hitting the air with more velocity) allowing more oxygen into the river than anywhere else, resulting in higher dissolved oxygen levels. Another factor in how the dissolved oxygen may vary in different parts of the river is the amount of tree or plant cover. The lower levels the 3rd and 4th test sites, (refer to maps) of the river become more overgrown and shrouded by trees, this will result in less sunlight getting through to the plants in the river, which in turn will mean that less oxygen is produced in photosynthesis by the plants as sunlight plays a key part in the process, so if you reduce sunlight you reduce photosynthesis and you reduce the amount of dissolved oxygen. So even though the water temperature may be lower because of the lack of heat from sunlight, and will therefore increase the amount of oxygen that it will be able carry before the saturation level is met, if the sunlight is not allowing plants to photosynthesis to produce oxygen then the levels of oxygen will remain low. So overall taking into account of the temperature, the river’s features (small rapids/waterfalls/tree cover etc.) and the amount of time plants have for photosynthesising in the day, I would say that the stream will have a moderate-high amount of dissolved oxygen in the water but not in all places; there should be higher concentrations near the rapids (site 2) and lower concentrations near where livestock are grazing by sites 1 and 4. So, the nearer to livestock and natural sources of decaying material the water is, the less oxygen there will be and the nearer (downstream) to rapids and waterfalls the water is the more oxygen there will be.
pH On the higher levels of the river near the head of the beck, the land becomes a bog which means the water there should be naturally more acidic because bogs are naturally acidic. The water in the lower levels of the valley where the ground is just normal farmland should have a more neutral pH as there are no natural factors that will change the acidity significantly. Bog land Naturally acidic Site 1 Water will therefore be acidic There is no noticeable acid rain to cause the pH of the water to decrease (in fact there is a strong population of lichen in the area which indicates that acid rain does not fall around here, otherwise there would be no lichen as acid rain is lethal to mosses such as lichen). Therefore, I would expect the pH of the water in sites 1 and 2 may be lower (more acidic) than in sites 3 and 4 where the water should be more neutral – the nearer the naturally acidic bog the site is, the more acidic the water will be.
Weather conditions Turbidity: I would expect the turbidity of the water to increase in wet, windy weather because there would be more water flowing through the test area to stir up material from the banks, such as mud and soil, and also the bed load that the river is carrying. The wind would also blow in materials such as leaves and branches which would add to the high levels of turbidity. However in dry, sunny conditions or when it is cloudy and dry, there will be little to disturb the bed load or brush in material from the banks, resulting in lower levels of turbidity and higher levels of clarity. Therefore, I expect that the turbidity will be high in wet and windy weather whereas when it is dry, sunny or cloudy, the turbidity will be lower. Temperature: The Temperature of the water will of course – as I said in the last set of hypotheses – vary depending on the weather. I would expect the temperature of the water to rise in warm weather, but fall in cooler weather when it rains or when there is a lot of cloud cover because the lower air temperature will force the water temperature down.
Dissolved oxygen: I would expect dissolved levels to increase when there is rain because as the rain drops into the water, it carries with it oxygen which adds to the amount already in the water. However in warm weather, more water is likely to evaporate and take away dissolved oxygen within the water vapour. With cloudy weather, I doubt the levels will change much and will probably stay at a moderate level. Therefore, the higher the temperature, the less oxygen there will be because some of the oxygen will be carried away with the evaporated water, however, the wetter and cooler the weather the more oxygen there will be as less of it will evaporate in water vapour and more will inputted into the stream through precipitation. pH: I would expect little change in the pH during different types of weather conditions as the weather has little to do with the acidity of the water, apart from rain. It would however have more of an effect if acid rain was common but as there is little, if any, acid rain in the Yorkshire dales (proven by the large amount of lichen here) I do not see how the weather conditions will have any affect on the water’s pH. Therefore, I do not predict any change in the pH in different weather conditions.
For the weather condition tests, I used site 3 only as this was the site closest and most conveniently positioned from where I could easily see what the weather was going to be like; I went out and collected the data on different days when the weather conditions varied the most. The water quality tests for the whole river were all performed on the same day so that varying weather conditions that may affect the results (something which I wanted to investigate in the other tests on site 3), would not be present to interfere with the accuracy of the results. Methods for tests: Overall equipment needed: • A ruler, • Rubber gloves, • A watch or timer, • A world water monitoring day kit, (which includes: container for collecting samples, adhesive Secchi disk, turbidity/pH/oxygen ppm chart, two adhesive thermometers (high and low temperatures), test sample vial, test tube, TesTabs® tablets for dissolved oxygen and pH tests, booklet for information and recording data).
Collection procedure: • Remove the cap of sampling jar. • Wear protective gloves. Rinse the jar 2-3 times with the stream water. • Hold the jar near the bottom and plunge it below the water surface. • Turn the submerged jar into the current and away from you. • Allow the water to flow into the jar for 30 seconds. • Cap the full jar while it is still submerged. Remove it from the river immediately. Turbidity test Equipment: Adhesive Secchi disk, turbidity chart and kit sampling jar. • Method: • Remove the backing from the Secchi disk icon sticker. • Adhere on the bottom of the kit container. Position the sticker slightly off centre. If possible adhere to the jar 8-24 hours before use to allow the adhesive to cure. • Fill the jar to the turbidity line located on the label as in the collection procedure (see last page). • Hold the turbidity chart on the top edge of the jar looking down into the jar, compare the appearance of the Secchi disk icon in the jar to the chart. Record the result as turbidity in JTU.
Temperature test Equipment: Sampling jar with thermometers adhered onto it, ruler and timer. Method: • Wear protective gloves • Place thermometer four inches below the water surface for one minute. • Remove the thermometer from the water, read the temperature and record the temperature as degrees Celsius.
Dissolved oxygen test Equipment: Sampling jar with thermometers, small vial, timer, two Dissolved Oxygen TesTabs®, dissolved oxygen chart and booklet table to determine saturation level. Method: • Record the temperature of the water sample • Submerge the small vial (0125) into the water sample. Carefully remove the vial from the water sample, keeping it full to the top. • Drop two Dissolved Oxygen TesTabs® (3976A) into the vial. Water will overflow when the tablets are added. 4. Screw the cap on the vial. more water will overflow as the cap is tightened. Make sure no bubbles are present in the sample. 5. Mix by inverting the vial over and over until the tablets have disintegrated. This will take about 4 minutes. 6. Wait 5 more minutes for the colour to develop. 7. Compare the colour of the sample to the dissolved oxygen colour chart. Record the result as ppm dissolved oxygen.
pH test Equipment: Test tube, one pH wide range TesTab and pH chart. Method: • Fill the test tube(0106 to the 10ml line with the water sample. • Add one pH wide range TesTab (6459A). • Cap and mix by inverting until the tablet has disintegrated. Bits of the material may remain in the sample. • Compare the colour of the sample with the pH colour chart. Record result as pH.
Weather Conditions Cloudy, not much sunlight, fair temperature. Partially cloudy, warm, sunny. Cloudy, windy with heavy rain. Turbidity 0 JTU. 0 JTU 40 JTU Results of tests in different weather conditions:
Weather Conditions Cloudy, not much sunlight, fair temperature. Partially cloudy, warm, sunny. Cloudy, windy with heavy rain. Water temp 10 Celsius. 12 Celsius 8 Celcius
Weather Conditions Cloudy, not much sunlight, fair temperature. Partially cloudy, warm, sunny. Cloudy, windy with heavy rain. Dissolved oxygen 8 ppm, water temperature 10 Celsius, 71 % saturation 8 ppm, water temperature 12 Celsius, 74% saturation 8 ppm, water temperature 8 Celsius, 68% saturation
Weather Conditions Cloudy, not much sunlight, fair temperature. Partially cloudy, warm, sunny. Cloudy, windy with heavy rain. pH 8 pH. 8 pH. 8pH.
Test sites: 1 2 3 4 Turbidity 40 JTU 0 JTU 0 JTU 40 JTU The results of water quality on sites 1, 2, 3 and 4. The Turbidity:
Test sites: 1 2 3 4 Water temperature 11 °C 10 °C 10 °C 12 °C
Test sites: 1 2 3 4 Dissolved Oxygen 8 ppm, water temperature 11 °C, 72.5 % saturation. 8 ppm, water temperature 10 °C, 71 % saturation. 8 ppm, water temperature 10 °C, 71 % saturation 8 ppm, water temperature 12 °C, 74 % saturation
Test sites: 1 2 3 4 pH of the water 7.5 pH 8 pH 8 pH 8 pH
Conclusionsfor weather conditions Turbidity Hypothesis: I expect that the turbidity will be high in wet and windy weather whereas when it is dry, sunny or cloudy, the turbidity will be lower. Conclusion: The hypothesis was shown to be true as the results show no turbidity at all in dry, cloudy and sunny condition but moderate levels in wet and windy weather. So therefore it is true to say that wet weather will affect the turbidity of the water by increasing the turbidity by increasing the amount of material in suspension and also material in the bed load. Dry or sunny weather without rain will have no affect on the tests. Graph on p29
Temperature hypothesis: I would expect the temperature of the water to rise in warm weather, but fall in cooler weather when it rains or when there is a lot of cloud cover because the lower air temperature will force the water temperature down. Conclusion: The graph shows that this is true, the temperature rose to 12 degrees Celsius in warm sunny weather when the temperature was higher than in cold, cloudy weather with precipitation when the air temperature was lower at 10 and 8 degrees Celsius. It also shows that the direct link between the temperature of the air with the temperature of the water is true, and that when the air temperature rises the water’s temperature will too and vice versa. So if there was rain on the day of the experiment, you should expect to find lower temperatures and vice versa in dry and sunny conditions depending on the air temperature. Graph on p30
Dissolved oxygen hypothesis: The higher the temperature, the less oxygen there will be because some of the oxygen will be carried away with water vapour that the heat in warm weather evaporates; however, the wetter and cooler the weather the more oxygen there will be because less will evaporate in water vapour as there is less heat for evaporation to take place and more will be inputted into the stream through precipitation. Conclusion: The hypothesis was proved to be incorrect because the ppm levels of each sample in different weathers were found to be equal, all reading at 8 ppm. Moreover, the dissolved oxygen saturation levels on the graph actually rose in warmer weather rather cooler, however, this doesn’t really show that the hypothesis was wrong because the ppm levels were all the same which means that the only reason why the saturation levels differed was because of the temperature not the actual amount of oxygen in the water. The kit I used only gave 3 readings of ppm for dissolved oxygen: 0 ppm, 4 ppm and 8 ppm which only shows whether the water contained poor, fair or good amounts of oxygen. Therefore, the kit isn’t very accurate for measuring higher levels of dissolved oxygen from the water and if a more sophisticated means of measuring the dissolved oxygen was used then differences may have been seen that might have supported or disagreed with the hypothesis – so the overall results should be seen as inconclusive. Graph on p31
pH hypothesis: I do not see how the weather conditions will have any affect on the water’s pH; therefore, I do not predict any change in the pH in different weather conditions. Conclusion: The results show that the hypothesis was correct, all samples in different weather conditions had a pH of 8. This shows the weather does not have any affect on the weather in this area but I should note that in areas with regular amounts of acid rain, the result would probably change and cause the water to become more acidic in wet conditions when precipitation would bring in acidic substances produced by air pollution from factories. Graph on p32
Conclusions for tests on sites 1, 2, 3 and 4 Turbidity hypothesis: I predict that the turbidity will be higher in places where livestock have the most access to the specific site; livestock has the most access to the stream at the start and finish of the stream section that I am testing, so sites 1 and 4 (nearest in terms of being downstream to livestock ‘hotspots’) should have higher turbidity. Conclusion: The results show that the hypothesis was very accurate, sites 1 and 4 had equal amounts of turbidity and were at higher levels than sites 2 and 3 which had no measurable turbidity. This shows that it is true to say that livestock does have an impact on the turbidity of water and the closer a test site is (downstream) to an area which has a large amount of livestock that can access the river, the higher the turbidity will be and vice versa. Graph on p33
Temperature hypothesis: I predict that the temperature of the water from sites 1 and 2 will be warmer than water from sites 3 and 4, that is, in warm weather. However, in cooler weather, I would not expect there to be a difference in temperatures because the waste excreted by animals may level out the range of temperatures increasing sites 1 and 4’s temperatures but leaving sites 2 and 3’s around the same. The weather on the day of the tests will ultimately decide whether the temperature will be higher or lower but generally as I said, I would expect the weather to be cool as the climate is generally at this time of the year, so I would expect little, if any, difference in the temperatures of the water samples from different sites. Conclusion: The day of the experiment was a cool, dry and cloudy day which meant if the hypothesis was true, then the water samples from each site would not differ by much at all. Looking at the results, the range (from the lowest to the highest) of temperatures was no more than 2 degrees Celsius and showed there was little difference in the temperatures, proving the hypothesis true in this aspect. The hypothesis was also shown to be accurate by predicting correctly that sites 1 and 4 would have warmer levels than sites 2 and 3 because of livestock activity upstream; the weather was cool so there was little heat to make a difference between the temperatures of the shaded and un-shaded areas and this allowed the theory of how livestock could increase the temperature in different ways to raise the temperatures of sites 1 and 4 above those of 2 and 3, regardless of whether they were shaded or not. So overall, the hypothesis was shown to be true in cool weather. Graph on p34
Dissolved oxygen hypothesis: There should be higher concentrations near the rapids (at site 2) and lower concentrations near where livestock are grazing (by sites 1 and 4). So, the nearer to livestock and natural sources of decaying material the water is, the less oxygen there will be and the nearer (downstream) to rapids and waterfalls the water is the more oxygen there will be. Conclusion: Interestingly, the results showed that there was no difference in the results for ppm, they were all at maximum ppm level for the test, but the saturation levels differed slightly but because all the sites had the same amounts of oxygen, this has little meaning in order to say whether one site is healthier than another.
Conclusion continued… The fact that the kit that was used only measured up to 8 ppm in testing meant that the results could only determine whether a site had a good, fair or poor amount of dissolved oxygen and if a more broad test was used then the results may have differed and helped to shed some light on whether the hypothesis was accurate or not. However, if the same results were obtained with improved testing, then there are some explanations listed below to show reasons why the levels of oxygen were equal: • There may have been an error in the testing process, Moss is present on the rocks which will fall into the river and decay like other materials from the banks of the river lowering the amount of dissolved oxygen • There were noticeable amounts of decaying matter on the river bed when I started to test the 2nd site (which I had not expected to find until I got there) and this may have neutralised the amount of oxygen that was added to the water through ‘white water’ from the waterfall/rapids upstream and caused the amounts of oxygen to decrease to the levels of the other sites that didn’t have ‘white water’, • The river had enough places where ‘white water’ may have occurred that were inaccessible and out-of-view which may have made other test sites levels of dissolved oxygen equal to those of site 2 because they had in fact, equal amounts of ‘white water’. • Graph on p35
pH hypothesis: I would expect the pH of the water in sites 1 and 2 to be lower (more acidic) than that of sites 3 and 4 where the water should be more neutral – the nearer the water is to a naturally acidic area, the more acidic it will be. Conclusion: The results did not really agree with the hypothesis in this case, as the sites nearly had all the same results of 8 pH with only site 1 having a result of 7.5 pH, only slightly different. The results did show that site one, in the bog where the ground is naturally acidic, was more acidic than the other sites but only by a small margin and even then it wasn’t even acidic, it was between neutral and slightly basic on the pH scale. One reason for this that was not acknowledged in the hypothesis is that the area around the test site is made up of limestone pavements and rocks such as sandstone which all share one characteristic, they can change the pH of water to a more alkaline one. Limestone escarpment, rain percolates through and becomes alkaline, groundwater or subsurface flow then runs into river
With precipitation percolating into these rocks (limestone pavements are on the surface so percolation is sometimes experienced before infiltration) and also runoff flowing into the river over these rocks, the water’s pH would have been changed by their alkaline properties to become more basic than preciously thought. However, the naturally acidic bog and soil around the area would have then lowered the pH from a higher basic level to only a slightly basic one. The lower areas may have also had their pH reduced to only a slightly alkaline level by acidic substances, like pesticides and fertilisers, introduced by livestock and biological factors. So, all in all, the hypothesis seems to have overlooked some factors such as the pH properties of local rocks which water would have had to pass through to get to the river, and has therefore been shown to be inaccurate in some ways. Graph on p36 Limestone and other alkaline rocks increase pH then acidic soil from the bog reduces pH to create slightly alkaline water
Overall conclusion for Austwick beck The tests showed that in all parameters, the water in Austwick beck is of a sufficient quality to sustain a healthy amount of biodiversity to keep the ecosystems functioning at healthy levels – the dissolved oxygen was at maximum levels on the testing scale, the pH was in the boundaries of the range that aquatic animals prefer to live in, the turbidity was low and in some places non-existent which is good for plants and animals and the temperature was at a stable level to support the ecosystem around it and can relied upon to remain that way seeing as the area it is situated in is quite rural and unlikely to see much more urbanisation or increased amounts of pollution. The beck was also shown to be fortunate enough to remain relatively unscathed by pollution and other adverse factors that are brought on and created by man, as it tumbles through beautiful and rich countryside in the safety of the Yorkshire dales national park where the authorities and environment agencies are very protective of everything within it, including Austwick beck.
Overall conclusion for the effect the weather has on the water quality Overall, the weather was shown to have some effects on the results of water quality but not in all parameters. The pH and dissolved oxygen content (the dissolved oxygen content was debatable as stated previously, the test was not very specific or exact in its measurements for oxygen) of the water did not change because of the weather but in the temperature and turbidity tests, as expected, the results were varied. It is safe to conclude then, that for turbidity and temperature tests, that the weather condition that has the most bearing on the results collected is rain and wind with extensive cloud cover.
Evaluation Overall I feel the data collection in the field and when writing up the results went very well: most of the results agreed with their hypothesise, the kit proved simple, easy and effective to use and the whole experiment was very enjoyable and still feels like a great success. However, I do think that there were a few areas that could have been improved, that is, if more time or resources were at hand, these include: • The kit was simple to use and effective in most ways, however, I feel that the kit in some ways, gave vague results, such as with the dissolved oxygen test, which produced the same results of 8 ppm when in fact the ppm scale can go up as high as 16. If some more advanced testing apparatus was used to do this test again then I expect the results would have been more accurate and would have helped to conclude how dissolved oxygen changes in places along the beck. • Also when the testing was actually performed, only one test per variable per test site was achieved because of lack of time to walk to each site (there was also a delay on the day of the tests when 2 of the original 6 sites where found to be privately owned and this therefore used up a lot of valuable time spent walking to these sites), the overall walking distance was around 5 miles (including the detour when 2 of the 6 sites were found to be private) which had to be covered on foot while at each site testing for each parameter. If there were more people to help me, apart from my poor brother who was dragged out(!), then more sites could have been tested more than once because we could have concentrated our efforts on one or two specific sites per person. If tests were done more than once – three times would have been the most efficient – and the results totalled and divided by however many tests (e.g. pH 8 + 6 + 7 = 21/3 = 7 average pH for site) to find the average which then would have given a more accurate and reliable spread of results.