Download
1 / 5
50 likes | 159 Views
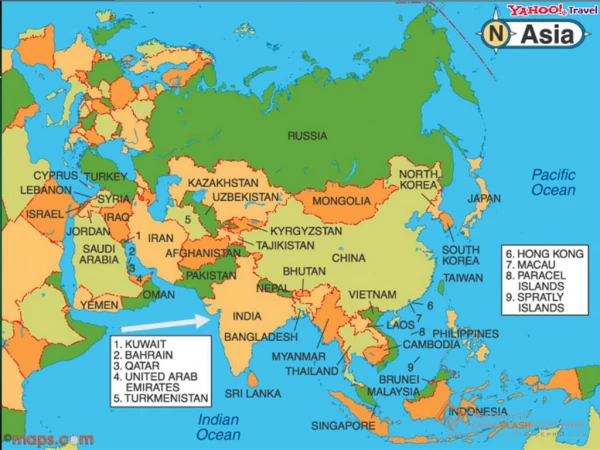
ZoomCharts is offering data visualization tools to support presenters at the International Conference on Advanced Computing Technologies and Applications, taking place March 26th to 27th, 2015 at The Club, 197, D.N. Nagar Municipal School Road, Andheri West, Mumbai, Maharashtra 400053, India. Check out what you can do with ZoomCharts charts and graphs at http://zoomcharts.com ZoomCharts is the world’s most interactive data visualization software. Create completely interactive, stunning visual representations of big data sets on modern devices at incredibly fast speeds. Be among the growing number of professionals in a variety of fields discovering the exciting potential that ZoomCharts tools opens up for analyzing and presenting data. The International Conference on Advanced Computing Technologies and Applications (ICACTA) is organized by Shri Vile Parle Kelavani Mandal’s Dwarkadas J. Sanghvi College of Engineering. ICACTA aims to provide a platform for researchers, academics, and worldwide industry professionals to share their computing technologies research in Information Technology and Computer Science. Participants are offered the opportunity to collaborate, network, and share ideas within the computing technologies community in order to learn and further their research. This year’s focus is on computing technologies such as Soft Computing, Ubiquitous and High Performance Computing, Network Computing, and Computing Applications. Sponsors include TATA Consultancy Services Limited (TCSL), EMC, IDEAL Credence, Eduabroad Consulting, the Computer Society of India, Collegepond, Imperial Overseas Education, Jamboree, KIC Education, The College Fever, and Institute of Foreign Studies. ZoomCharts http://www.zoomcharts.com The world’s most interactive data visualization software

E N D
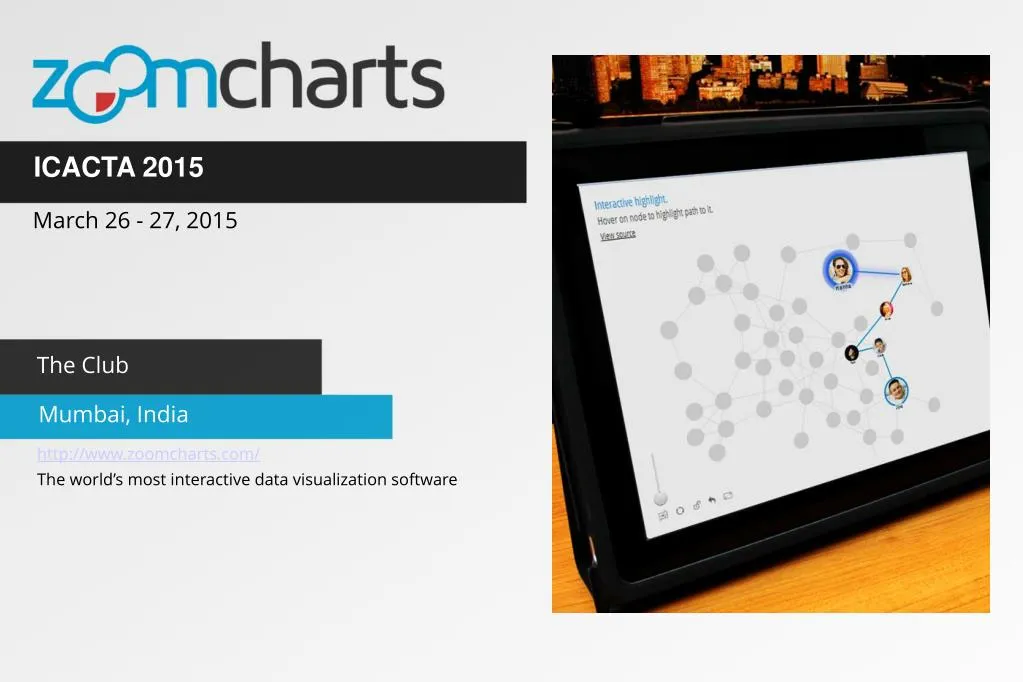
ICACTA 2015 March 26 - 27, 2015 The Club Mumbai, India http://www.zoomcharts.com/ The world’s most interactive data visualization software
ZoomCharts For ICACTA 2015 March 26-27, 2015 ZoomCharts is offering data visualization tools to support presenters at the International Conference on Advanced Computing Technologies and Applications, taking place March 26th to 27th, 2015 at The Club, 197, D.N. Nagar Municipal School Road, Andheri West, Mumbai, Maharashtra 400053, India. Check out what you can do with ZoomCharts charts and graphs at http://zoomcharts.com ZoomCharts is the world’s most interactive data visualization software. Create completely interactive, stunning visual representations of big data sets on modern devices at incredibly fast speeds. Be among the growing number of professionals in a variety of fields discovering the exciting potential that ZoomCharts tools opens up for analyzing and presenting data. The International Conference on Advanced Computing Technologies and Applications (ICACTA) is organized by Shri Vile Parle Kelavani Mandal’s Dwarkadas J. Sanghvi College of Engineering.
ZoomCharts For ICACTA 2015 March 26-27, 2015 ICACTA aims to provide a platform for researchers, academics, and worldwide industry professionals to share their computing technologies research in Information Technology and Computer Science. Participants are offered the opportunity to collaborate, network, and share ideas within the computing technologies community in order to learn and further their research. This year’s focus is on computing technologies such as Soft Computing, Ubiquitous and High Performance Computing, Network Computing, and Computing Applications. Sponsors include TATA Consultancy Services Limited (TCSL), EMC, IDEAL Credence, Eduabroad Consulting, the Computer Society of India, Collegepond, Imperial Overseas Education, Jamboree, KIC Education, The College Fever, and Institute of Foreign Studies.
ZoomCharts For ICACTA 2015 March 26 - 27, 2015
Check out ZoomCharts products: Network Chart Big network exploration Explore linked data sets. Highlight relevant data with dynamic filters and visual styles. Incremental data loading. Exploration with focus nodes. Time Chart Time navigation and exploration tool Browse activity logs, select time ranges. Multiple data series and value axes. Switch between time units. Pie Chart Amazingly intuitive hierarchical data exploration Get quick overview of your data and drill down when necessary. All in a single easy to use chart. Facet Chart Scrollable bar chart with drill-down Compare values side by side and provide easy access to the long tail. ZoomCharts http://www.zoomcharts.com/ The world’s most interactive data visualization software