Download
1 / 4
40 likes | 211 Views
ZoomCharts is offering data visualization tools to support presentations at DEVNEXUS 2015, taking place from March 10th to 12th, 2015 at the Cobb Galleria Centre in Atlanta, Georgia. Check out what you can do with ZoomCharts charts and graphs at http://zoomcharts.com ZoomCharts’ line of advanced data visualization software is fully interactive, supports big data, works on all modern devices including touch screens, and does it all at incredibly fast speeds. These tools are being discovered by a growing number of clients in a variety of fields as the best way to analyze and present data. Don’t be among the last to discover the exciting potential that ZoomCharts tools can open up for your data. DEVNEXUS is a professional software developers conference that takes place over 3 days and features over 1500 developers, 6 workshops, 12 tracks, and 120 presentations. Take part in events on topics such as HTML5, big data integration, JavaScript, functional web design, responsive web design, UX design, DevOps, and many, many more. This highly popular event has sold out early the last six years, and includes big name sponsors such as IBM, Microsoft, GitHub, and Oracle. Check out ZoomCharts products: Network Chart Big network exploration Explore linked data sets. Highlight relevant data with dynamic filters and visual styles. Incremental data loading. Exploration with focus nodes. Time Chart Time navigation and exploration tool Browse activity logs, select time ranges. Multiple data series and value axes. Switch between time units. Pie Chart Amazingly intuitive hierarchical data exploration Get quick overview of your data and drill down when necessary. All in a single easy to use chart. Facet Chart Scrollable bar chart with drill-down Compare values side by side and provide easy access to the long tail. ZoomCharts http://www.zoomcharts.com The world’s most interactive data visualization software

E N D
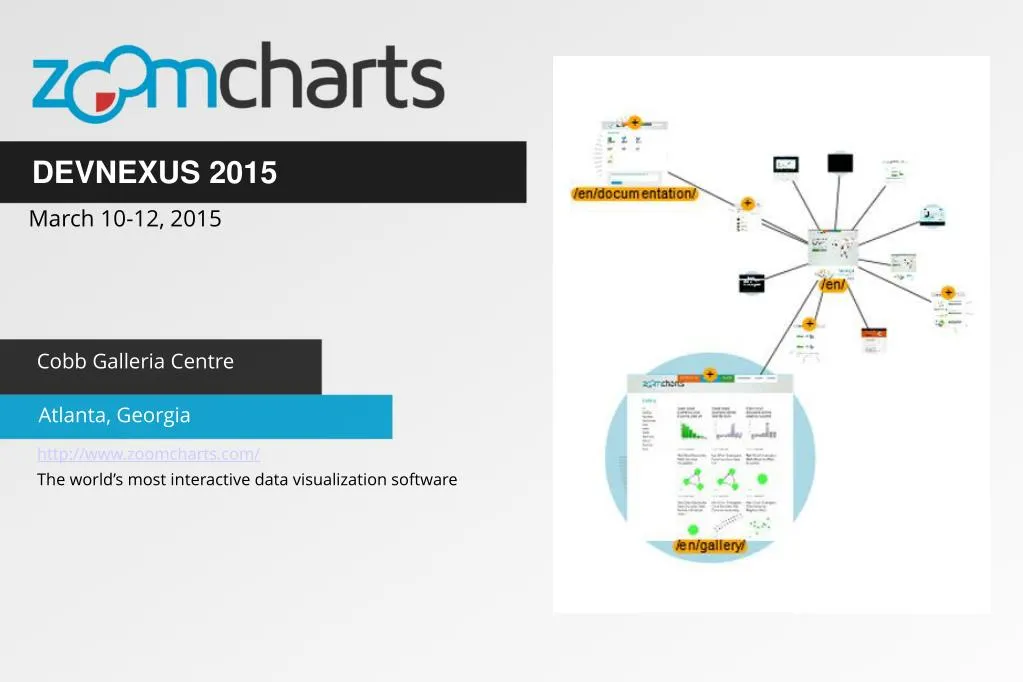
DEVNEXUS 2015 March 10-12, 2015 Cobb Galleria Centre Atlanta, Georgia http://www.zoomcharts.com/ The world’s most interactive data visualization software
ZoomCharts for DEVNEXUS 2015 March 10-12, 2015 ZoomCharts is offering data visualization tools to support presentations at DEVNEXUS 2015, taking place from March 10th to 12th, 2015 at the Cobb Galleria Centre in Atlanta, Georgia. Check out what you can do with ZoomCharts charts and graphs at http://zoomcharts.com ZoomCharts’ line of advanced data visualization software is fully interactive, supports big data, works on all modern devices including touch screens, and does it all at incredibly fast speeds. These tools are being discovered by a growing number of clients in a variety of fields as the best way to analyze and present data. Don’t be among the last to discover the exciting potential that ZoomCharts tools can open up for your data. DEVNEXUS is a professional software developers conference that takes place over 3 days and features over 1500 developers, 6 workshops, 12 tracks, and 120 presentations. Take part in events on topics such as HTML5, big data integration, JavaScript, functional web design, responsive web design, UX design, DevOps, and many, many more. This highly popular event has sold out early the last six years, and includes big name sponsors such as IBM, Microsoft, GitHub, and Oracle. hthttps://zoomcharts.com/en/blog/zoomcharts-for-devnexus-2015-march-10-12-2015
ZoomCharts For DEVNEXUS 2015 March 10-12, 2015
Check out ZoomCharts products: Network Chart Big network exploration Explore linked data sets. Highlight relevant data with dynamic filters and visual styles. Incremental data loading. Exploration with focus nodes. Time Chart Time navigation and exploration tool Browse activity logs, select time ranges. Multiple data series and value axes. Switch between time units. Pie Chart Amazingly intuitive hierarchical data exploration Get quick overview of your data and drill down when necessary. All in a single easy to use chart. Facet Chart Scrollable bar chart with drill-down Compare values side by side and provide easy access to the long tail. ZoomCharts http://www.zoomcharts.com/ The world’s most interactive data visualization software