Download
1 / 20
200 likes | 327 Views
ZoomCharts was delighted to be a part of the ignition event that took place at Birojnīca, Mill Street 84/2, Rīga, LV 1050, Latvia, on March 3rd, 2015 to celebrate the launch of Labs of Latvia. Labs of Latvia is a brand new Rīga based community platform for Latvian startups by Latvian startups. It provides information about the Latvian startup scene for startups, investors, media, and the Latvian startup community at large. The ignition event included a live unveiling of the platform by key speaker Christina Forsgård, and gave startups the chance to network, enjoy snacks, and to sit back and evaluate while investors and communities made pitches. The fantastic event gave the ZoomCharts team the chance to catch up with their growing group of current clients who spoke of their highly satisfying experience so far, and to showcase ZoomCharts’ many exciting developments in the works to potential clients who were very excited about what ZoomCharts has to offer. ZoomCharts is a leading data visualization provider, offering the world’s most interactive data visualization software. All charts and graphs are completely interactive, support big data sets, work on all modern devices including touch screens, and perform at incredibly fast speeds. Be among the growing number of professionals discovering the exciting potential that ZoomCharts has in improving the efficiency of data analysis and presentation. ZoomCharts http://www.zoomcharts.com The world’s most interactive data visualization software

E N D
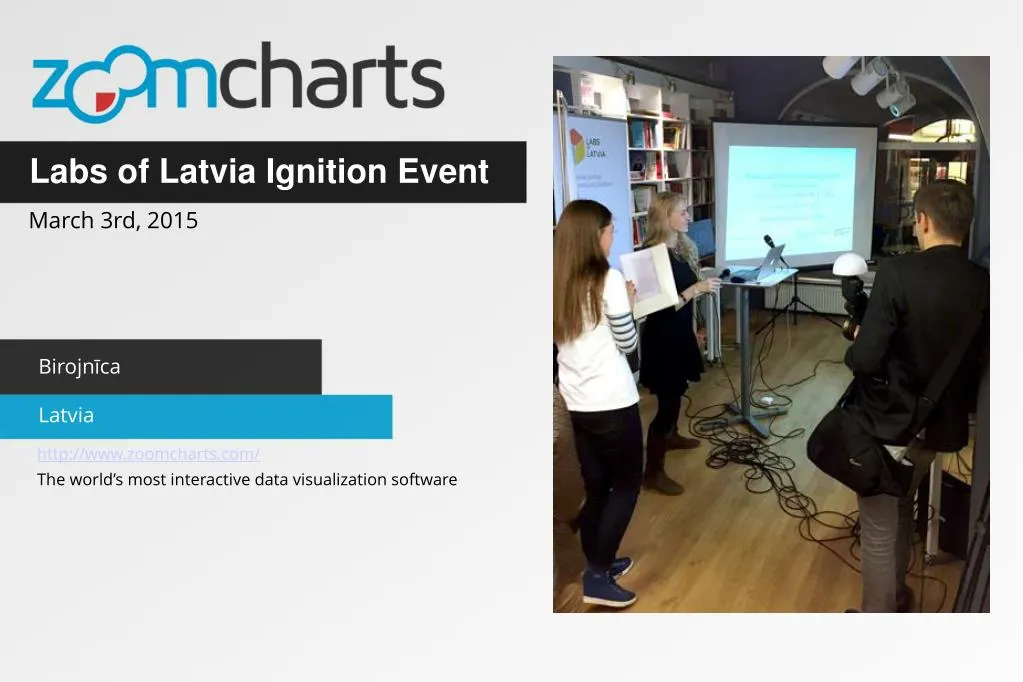
Labs of Latvia Ignition Event March 3rd, 2015 Birojnīca Latvia http://www.zoomcharts.com/ The world’s most interactive data visualization software
ZoomCharts at the Labs of Latvia Ignition Event March 3rd, 2015 ZoomCharts was delighted to be a part of the ignition event that took place at Birojnīca,Mill Street 84/2, Rīga, LV 1050, Latvia, on March 3rd, 2015 to celebrate the launch of Labs of Latvia. Labs of Latvia is a brand new Rīga based community platform for Latvian startups by Latvian startups. It provides information about the Latvian startup scene for startups, investors, media, and the Latvian startup community at large. The ignition event included a live unveiling of the platform by key speaker Christina Forsgård, and gave startups the chance to network, enjoy snacks, and to sit back and evaluate while investors and communities made pitches. The fantastic event gave the ZoomCharts team the chance to catch up with their growing group of current clients who spoke of their highly satisfying experience so far, and to showcase ZoomCharts’ many exciting developments in the works to potential clients who were very excited about what ZoomCharts has to offer. ZoomCharts is a leading data visualization provider, offering the world’s most interactive data visualization software. All charts and graphs are completely interactive, support big data sets, work on all modern devices including touch screens, and perform at incredibly fast speeds. Be among the growing number of professionals discovering the exciting potential that ZoomCharts has in improving the efficiency of data analysis and presentation.
ZoomCharts at the Labs of Latvia Ignition Event March 3rd, 2015 A member of Garage48 begins an intriguing presentation at the Labs of Latvia ignition event on March 3rd, 2015.
ZoomCharts at the Labs of Latvia Ignition Event March 3rd, 2015 A presentation at the Labs of Latvia ignition event on March 3rd, 2015 engages the audience.
ZoomCharts at the Labs of Latvia Ignition Event March 3rd, 2015 A presentation on Latvian entrepreneurship is on display at the Labs of Latvia ignition event on March 3rd, 2015. Latvia currently has the highest rate of entrepreneurs per adult in Europe at 13%.
ZoomCharts at the Labs of Latvia Ignition Event March 3rd, 2015 Keynote speaker Christina Forsgård kicks off the Labs of Latvia ignition event on March 3rd, 2015.
ZoomCharts at the Labs of Latvia Ignition Event March 3rd, 2015 Keynote speaker Christina Forsgård gives an interesting presentation the Labs of Latvia ignition event on March 3rd, 2015 while the audience looks on.
ZoomCharts at the Labs of Latvia Ignition Event March 3rd, 2015 A presentation from investment company Imprimatur Capital engages the audience at the Labs of Latvia ignition event on March 3rd, 2015.
ZoomCharts at the Labs of Latvia Ignition Event March 3rd, 2015 The Labs of Latvia ignition event is in full swing at Birojnīca on March 3rd, 2015.
ZoomCharts at the Labs of Latvia Ignition Event March 3rd, 2015 A talk from investment company Imprimatur Capital is geared toward the Latvian startup community at the Labs of Latvia ignition event on March 3rd, 2015.
ZoomCharts at the Labs of Latvia Ignition Event March 3rd, 2015 Latvia currently has the highest rate of entrepreneurs in Europe, as displayed in a Latvian entrepreneurship presentation at the Labs of Latvia ignition event on March 3rd, 2015.
ZoomCharts at the Labs of Latvia Ignition Event March 3rd, 2015 An investor presentation is ready to go at the Labs of Latvia ignition event on March 3rd, 2015.
ZoomCharts at the Labs of Latvia Ignition Event March 3rd, 2015 The Labs of Latvia ignition event, which took place on March 3rd, 2015, is well under way as a speaker presents to a room full of entrepreneurs, investors, and members of the Latvian startup community.
ZoomCharts at the Labs of Latvia Ignition Event March 3rd, 2015 TechHub Academy presents the Rietumu FinTech Challenge 2015 at the Labs of Latvia ignition event on March 3rd, 2015.
ZoomCharts at the Labs of Latvia Ignition Event March 3rd, 2015 A presentation is given to entrepreneurs, investors, and members of the Latvian startup community at the Labs of Latvia ignition event on March 3rd, 2015.
ZoomCharts at the Labs of Latvia Ignition Event March 3rd, 2015 Rudolfs Krese of ZGI speaks to startups, investors, and entrepreneurs at the Labs of Latvia ignition event on March 3rd, 2015.
ZoomCharts at the Labs of Latvia Ignition Event March 3rd, 2015 A speaker gives an insightful presentation to startups, investors, and entrepreneurs at the Labs of Latvia ignition event on March 3rd, 2015.
ZoomCharts at the Labs of Latvia Ignition Event March 3rd, 2015 The presentations are underway at the Labs of Latvia ignition event, which took place at Birojnīca on March 3rd, 2015.
ZoomCharts at the Labs of Latvia Ignition Event March 3rd, 2015 A presentation by TechHub invigorates an audience of startups, entrepreneurs, and investors at the Labs of Latvia ignition event on March 3rd, 2015.
Check out ZoomCharts products: Network Chart Big network exploration Explore linked data sets. Highlight relevant data with dynamic filters and visual styles. Incremental data loading. Exploration with focus nodes. Time Chart Time navigation and exploration tool Browse activity logs, select time ranges. Multiple data series and value axes. Switch between time units. Pie Chart Amazingly intuitive hierarchical data exploration Get quick overview of your data and drill down when necessary. All in a single easy to use chart. Facet Chart Scrollable bar chart with drill-down Compare values side by side and provide easy access to the long tail. ZoomCharts http://www.zoomcharts.com/ The world’s most interactive data visualization software