Download
1 / 23
230 likes | 338 Views
Spatial and Temporal Patterns of the Contemporary Carbon Sources and Sinks in the Ridge and Valley Ecoregion of the United States. Shuguang Liu and Thomas Loveland USGS National Center for Earth Resources Observation and Science Sioux Falls, SD 57198. Outline. The US Carbon Trends Project

E N D
Spatial and Temporal Patterns of the Contemporary Carbon Sources and Sinks in the Ridge and Valley Ecoregion of the United States Shuguang Liu and Thomas Loveland USGS National Center for Earth Resources Observation and Science Sioux Falls, SD 57198 2005 USDA Greenhouse Gas Symposium
Outline • The US Carbon Trends Project • Research Questions • Methodology • The Ridge and Valley Ecoregion • Land Cover Change • Spatial and Temporal Variability of C Stocks and Fluxes 2005 USDA Greenhouse Gas Symposium
Overarching Research Questions of the US Carbon Trends Project • What is the spatial, temporal, and sectoral variability of conterminous U.S. land cover change from 1973 to 2000. • What are the spatial and temporal distributions of carbon sources and sinks, and therefore the dynamics of carbon storage in the conterminous U.S.? • What are the major driving forces that dictate the evolution of US terrestrial carbon storage and the CO2 exchange between the land and the atmosphere? • What are the major uncertainties and knowledge gaps associated with estimating regional and national carbon dynamics? 2005 USDA Greenhouse Gas Symposium
US Land Cover Change There is no consistent database available that characterizes the contemporary US land cover change, because • Land cover change mapping over large areas is a major effort • Labor intensive • Money (funding sources) 2005 USDA Greenhouse Gas Symposium
Thousands of Sampling Blocks US Land Cover Change Detection • Probability-based sampling strategy used to provide efficient and reliable estimates of land cover change over large areas. Goal is to detect within one percent of actual change at 85% confidence level. • Ecoregions are sampling strata • Land cover change was detected using Landsat images (i.e., 1973, 1980, 1986, 1992, and 2000) • Sampling units are 20- or 10-km2. • Samples randomly selected within strata. • Sample size based on expected spatial variability of change in the strata. 2005 USDA Greenhouse Gas Symposium
Spatially Explicit Modeling GEMS (General Ensemble Biogeochemical Modeling System) • An advanced modeling systems for spatially explicit simulation of biogeochemical cycling over large areas • Developed at USGS National Center for Earth Resources Observation and Science • Deployment of the encapsulated plot-scale model in space is based on a Joint Frequency Distribution of the major controlling variables (e.g., land cover, climate, soil, etc.). • Included data assimilation algorithms • It includes a dynamic land cover/use change submodel • Stochasticsimulations to incorporate uncertainties in input data • Uncertainty estimate of carbon dynamics • Major applications (US, Africa, and Central America) 2005 USDA Greenhouse Gas Symposium
Thousands of Sampling Blocks Spatially Explicit Modeling National Benchmark Databases Land Cover: USGS Land Cover Trends Soil: STATSGO Climate: CRTUS2.0 (1900 – 2000) N Deposition: National Atmospheric Deposition Program Crop Information: USDA Agricultural Census Data FIA: Forest biomass, NPP, Age Distribution GEMS Carbon dynamics simulated at 60 m x 60 m spatial resolution within 20 km x 20 km or 10-km by 10-km sampling blocks 2005 USDA Greenhouse Gas Symposium
Spatially Explicit Modeling Quantify the spatial and temporal changes of C stocks, fluxes, and uncertainty at various scales Block Ecoregion Nation (10 km) (60 m resolution) 2005 USDA Greenhouse Gas Symposium
Ridge and Valley Ecoregion Geographic Location and Samples The ecoregion spans 8 states. A total of 40 10-km by 10-km sample blocks were randomly selected for land cover change detection and subsequent carbon simulations. 2005 USDA Greenhouse Gas Symposium
Ridge and Valley Ecoregion Land Cover Composition Around 1973 Forest: 57.1% Cropland: 31.4% Urban: 7.9% 2005 USDA Greenhouse Gas Symposium
Ridge and Valley Ecoregion Land Cover Change 1973-2000 • Extensification of forest harvesting activities • Forest area reduction: for2trans > trans2for • Ag land reduction: ag2for for2ag and urbanization • Urbanization (for2urban, ag2urban) • Annual change rate increases with time (A) Annual rate of land cover change during four time periods. (B) the total share percentage of six major land cover change activities (C through F) in the total change rate, and (C through F) the share percentages of the major land cover change activities. Land cover compositions (%) 2005 USDA Greenhouse Gas Symposium
Forest Inversion FIA data: biomass stock by age class (therefore biomass accumulation rates implicitly used) and total standing biomass MODIS: annual NPP 2000-2001 2005 USDA Greenhouse Gas Symposium
C Sink vs. C Sequestration C Sequestration = C Sink - C Removal and C Removal = GrainYield + WoodHarvested 2005 USDA Greenhouse Gas Symposium
Ridge and Valley Ecoregion Interannual and Spatial Variability (Blocks) Data show block-scale annual averages from 1973 to 2000; X axis shows spatial variability across 10-km by 10-km blocks; Y axis shows interannual fluctuations by blocks. 2005 USDA Greenhouse Gas Symposium
Ridge and Valley Ecoregion Interannual and Spatial Variability (Blocks) Data show block-scale annual averages from 1973 to 2000; X axis shows spatial variability across 10-km by 10-km blocks; Y axis shows interannual fluctuations by blocks. Net Primary Productivity (NPP) Large interannual variability Total Carbon Stock Change • C sequestration strength increases from north (lower block ID numbers) to south; • Large interannual variability Soil Organic Carbon Change Relatively smaller variability 2005 USDA Greenhouse Gas Symposium
Ridge and Valley Ecoregion C Stock and Land Cover Composition (Blocks) C stock at the block scale is • Positively correlated to forest fraction; • Negatively correlated to cropland fraction; • Not related to other land cover types. 2005 USDA Greenhouse Gas Symposium
Ridge and Valley Ecoregion C Sequestration and Land Cover Composition (Blocks) C sequestration at the block scale is • Positively correlated to forest fraction; • Negatively correlated to cropland fraction; • Not related to other land cover types. 2005 USDA Greenhouse Gas Symposium
Ridge and Valley Ecoregion Carbon Rich Gets Richer (Blocks) C change rate in biomass and soils increases with total C stock Soil sequestration accounted for about 35% of the total C sequestration Soil was a C source when total C sequestration was less than 50 g C m-2 y-1 2005 USDA Greenhouse Gas Symposium
Ridge and Valley Ecoregion Temporal Change of C Stocks (Ecoregion) 2005 USDA Greenhouse Gas Symposium
Ridge and Valley Ecoregion Temporal Change of C Fluxes (Ecoregion) • Large inter-annual variability in NPP, C sequestration, and total C sink. • Soil C sink and total C sink is decoupled. • C sequestration is tightly coupled with C sink strength. • Harvested wood C increased over time because of extensification of clearcutting. • The average C sequestration rate was 96 12 (1) gC m-2 y-1. 2005 USDA Greenhouse Gas Symposium
Ridge and Valley Ecoregion C Sinks and C Sequestration (Ecoregion) C sequestration is tightly coupled with C sink strength. 2005 USDA Greenhouse Gas Symposium
Summary • Land cover change was very dynamic. Major changes include urban expansion, reduction in cropland area, and extensification of clearcutting activities. • Large spatial and inter-annual variability in NPP, C sequestration, and total C sink. • C change rate in biomass and soils increases with total C stock • Soil C sink and total C sink is decoupled. • C sequestration is tightly coupled with C sink strength. • Harvested wood C increased over time because of extensification of clearcutting. • The average C sequestration rate was 96 12 (1) gC m-2 y-1. • Soil sequestration accounted for about 35% of the total C sequestration. Soil was a C source when total C sequestration was less than 50 g C m-2 y-1 2005 USDA Greenhouse Gas Symposium
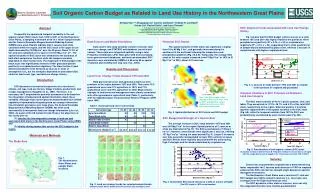
Poster 312 Soil Organic Carbon Budget as Related to Land Use History in the Northwestern Great Plains 2005 USDA Greenhouse Gas Symposium