Download
1 / 66
691 likes | 1.09k Views
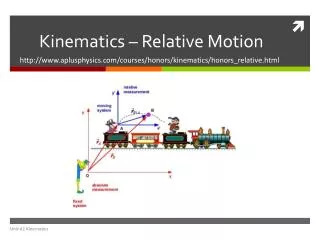
Relative Motion. Frames of Reference. Object or point from which motion is determined Most common is the earth Motion is a change in position relative to a frame of reference. What is motion?.

E N D
Frames of Reference • Object or point from which motion is determined • Most common is the earth • Motion is a change in positionrelative to a frame of reference
What is motion? • If you are standing in one place, and your friend walks by you, are you moving relative to your friend? • Is your friend moving relative to you? • Is either of you moving relative to the earth?
Answer: • You are moving relative to your friend, and your friend is moving relative to you! • You are not moving relative to the earth, but your friend is. You are both moving relative to the sun!
What is motion? • If you and your friend are walking down the hall together at the same speed, in the same direction, are you moving relative to your friend? • Is your friend moving relative to you? • Are either of you moving relative to the earth?
Answer: • You are NOT moving relative to your friend, and your friend is NOT moving relative to you. You both are moving relative to the earth.
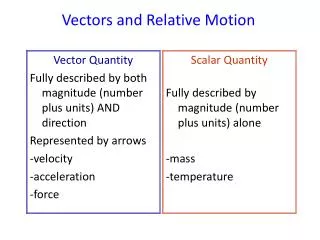
Uniform motion Uniform motion – occurs when an object is moving at a constant speed/ velocity in a straight line. Constant speed/velocity- means that the object is covering the same distance per unit of time. Scalar – any quantity that is represented by a magnitude and a unit. Vector – any quantity that is represented by a Magnitude, a unit and a direction.
Distance and Displacement • Distance(d) is a scalar measure of the actual path between two locations . • It has a magnitude and a unit. • Ex: 50 m, 2.5 hrs. • Displacement(d) is a vector measure of the change in position measured in a straight line from a starting reference point. • Ex: 5 m [W]
Sign Convention • In physics we will use a standard set of signs and directions. • Up, right, east and north are positive directions. ( + ) • Down, left, west, and south are negative directions. ( - )
Distance – total trip d total = d1 + d2 + d3 + d4 d total = 2m + 4m + 2m+ 4m d total = 20 m Displacement – change in position d total = +d1 + +d2 + -d3 + -d4 d total = +2m + +4m + -2m+ -4m d total = 0 m
Speed • Speed = Change in distance ÷ Time Δ d_ V T Example: A car travels 300km in 6 hours. What is the speed of the car?
Answer: • Speed = distance ÷ time • Speed = 300km ÷ 6 hours • Speed = 50km/hr
More practice • 1. How far can a plane travel if it flies 800km/hr for 9 hours? • 2. How long does it take a ship to go 500 km if it travels at a speed of 50km/hr?
Answer 1. Δ d V T Δ d 800 9 800km ▪ 9hrs = 7200km hr
Answer 2. Δ d V T 500 50 T 500km ÷ 50km = 10 hrs hr
Instantaneous Speed • Instantaneous speed is speed at any instant in time. • A speedometer measures speed in ‘real time’ (the instantaneous speed).
Average Speed • Average speed is the average of all instantaneous speeds; found simply by a total distance/total time ratio • The average speed of a trip: Vavg = d1 + d2 + d3 + d4........ t1 + t2 + t3 + t4 ..........
Velocity • Speed in a given direction is velocity ( vector). • What is the velocity of a boat that travels from St. John’s, west to Longpond • (16 Km ) in 2.5 h ?
Answer • Velocity = displacement ÷ time • Velocity = 16 Km ÷ 2.5 h • Velocity = 6.4 km/h • Velocity = 6.4 km/h west
Change your answer to m/s! • = 6.4 km/h ÷ 3.6 = 1.8 m/s Km/hr to m/s conversion trick Km/hr m/s m/s K/hr Divide by 3.6 multiply by 3.6
Difference Between Speed and Velocity Scalar Quantities ( Number and unit) Vector Quantities ( Number, unit and direction) 10 Km West 50 Km/hr south 100 newtons right Velocity (Speed and Direction) Volume liters Distance Voltage Speed (KM/h) Speed is a Scalar Quantity Velocity is a Vector Quantity
Distance-time graphs • On your paper, graph the following: • D (m) T (sec) 0 0 5 7 10 14 15 21
Distance (m) time (sec)
Was your graph a straight line? • A distance-time graph which is a straight line indicates constant speed. • In constant speed, the object does not speed up or slow down. The acceleration is zero.
y2 y1 x1 x2 On a distance time graph for uniform motion the slope equals the average speed. Vavg =Δd Δt
What is the Vavg for this graph? 8 - 4 = 4 = 2m/s 4 – 2 2
Displacement Time Graphs • Like distance time graphs only displacement can be either positive or negative, therefore we need two quadrants. d d d d t t t t Stopped right of origin Stopped left of origin Moving left away from origin Moving right toward origin from left
d B A t C Graphing ! A … Starts at home (origin) and goes right (+) slowly B … Stopped (position remains constant as time progresses) C … Turns around and goes in the (-) direction quickly, passing by home
Explain what is happening for each leg of the trip. What is the velocity for each leg of the trip? Hint: slope= rise/ run = Δ d = d2 – d1 = Avg. velocity t t2 – t1
Graph the following on a distance-time graph: • d (m) t (s) 0 0 5 1 20 2 45 3 80 4 125 5
Distance (m) 0 1 2 3 4 5 time (sec)
Was your graph a curve? • A graph that curves on a distance-time graph shows that the object is accelerating ( non-uniform motion). • Acceleration.
Distance-time graphs • Describe the motion of the object as shown in the graph. From 0-8 sec, constant speed: (25 m/sec); From 8-12 sec, no motion (stop); From 12-16 sec, acceleration; From 16-20 sec, constant speed
Speed-time graphs • Using the distance-time graph from the last frame, draw a speed time graph. First fill in the table below: Average Speed (m/s) Time (sec) ____ 0 to 8 ____ 8 to 12 ____ 12 to 20 25 0 37.5 Draw on board
What does your graph look like? • Constant speed will be a horizontal line on a speed time graph. • If the speed decreases, the line will slant down. • If the speed increases, the line will slant up.
On a velocity - time graph the area between the graphed line and the x-axis equals the displacement Area = l x w = 6 s x 30 m/s = 180 m
This object is slowing down in a positive direction. It is non-uniform motion. However we can still calculate the displacement by finding the area of the triangle. ( ½ base x height ) Displacement = ½ base x height = ½ 25.0 m/s x 25.0 s = 312.5 m Note how the units cancel.
Object is moving at a constant speed for 5.0 s then it speeds up for the next 5.0 sec. Displacement = area of rectangle + area of a triangle = l x w + ½ base x height = 10.0 s x 5.0m/s + ½ 10.0 m/s x 5.0 s = 50 m + 25 m = 75m
Object moving right and speeding up. (+) Object moving left and speeding up. (-) Object moving right and slowing down. (+) Object moving left and slowing down (-)
The slope of the line on a velocity time graph equals the average acceleration. For uniform motion the graph is horizontal, therefore the slope is zero and the acceleration is zero.
d Graphing w/ Acceleration C B t A D A … Start from rest south of home; increase speed gradually B … Pass home; gradually slow to a stop (still moving north) C … Turn around; gradually speed back up again heading south D … Continue heading south; gradually slow to a stop near the starting point
d Tangent Lines t On a position vs. time graph: The slope of a tangent line will give the velocity at that point in time. ( instantaneous velocity )
v t a t Graphing Tips The same rules apply in making an acceleration graph from a velocity graph. Just graph the slopes! Note: a positive constant slope in blue means a positive constant green segment. The steeper the blue slope, the farther the green segment is from the time axis.
d t Area under a velocity graph “forward area” “backward area” Area above the time axis = forward (positive) displacement. Area below the time axis = backward (negative) displacement. Net area (above - below) = net displacement. Total area (above + below) = total distance traveled.
d t All 3 Graphs v t a t
Acceleration • Change in velocity • Can be change in speed or direction • Acceleration = ∆V/ ∆T • ∆V a t