Download
1 / 8
80 likes | 174 Views
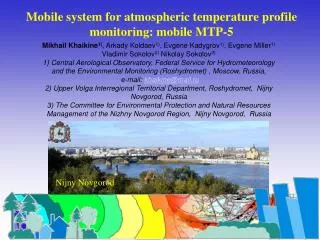
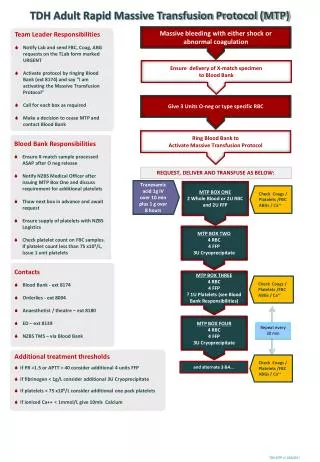
The Microwave Temperature Profiler (MTP) on START-08. MJ Mahoney - JPL/Caltech Julie Haggerty - NCAR Jan 9, 2008. The NSF/NCAR GV Microwave Temperature Profiler (MTP). Top View. Scan Mirror. Frequency Synthesizer. Cal Target. StepMotor. Radiometer. Bottom View.

E N D
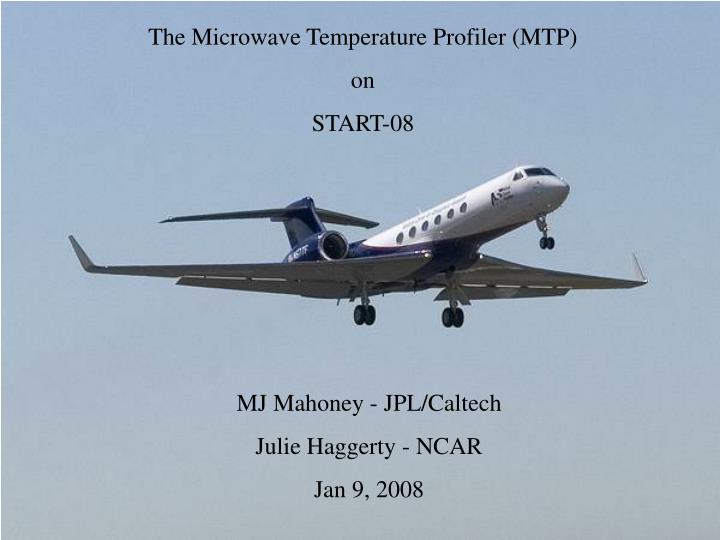
The Microwave Temperature Profiler (MTP) on START-08 MJ Mahoney - JPL/Caltech Julie Haggerty - NCAR Jan 9, 2008
The NSF/NCAR GV Microwave Temperature Profiler (MTP) Top View Scan Mirror Frequency Synthesizer Cal Target StepMotor Radiometer Bottom View Controller Board DC Power Supplies HDPE Window
The Molecular Oxygen Absorption Spectrum (0-20 km) Molecular oxygen absorption is the result of 44 rotational spectral lines from 50 to 835 GHz; 37 lines are in the 60 GHz band. Below ~10 km the lines are heavily pressure-broadened and line shape is not important. Above 10 km line shape starts to matter.
Applicable Height MTP Measurements Technique In the R-J limit the oxygen emission from a thin layer (dr) is proportional to the temperature times the absorption coefficient times the layer thickness attenuated by the intervening absorption: where W(r) is the weighting function. If the absorption coefficient is nearly constant and the temperature changes proportional to range (r) then:
MTP Performance During CRAVE Above: The overall MTP performance relative to flight level for 23 comparisons with Ticosondes (1-sigma error bars are shown). Left: Examples of two MTP retrievals (pink) compared to Ticosondes (white).
Data Products - Temperature Profile An Altitude Temperature Profile (ATP) from the NASA DC-8 MTP. The yellow dots are the retrieved temperatures, the horizonal yellow line is the aircraft altitude and the horizontal dashed line is the tropopause altitude. Other information is also shown.
Data Products - Temperature Curtain • CTC for DC-8 TOTE-VOTE transit flight from Fairbanks, Alaska to Hawaii • Flight level is black trace, tropopause is shown as white dots • The polar jet is at 57N and the subtropical jet is at 33N; note double trop region
Data Products - Isentropes ATPs can be used to identify constant theta, or isentrope, levels -- the streamlines on which air parcels flow. The figure above illustrates DC-8 observations of a dramatic mountain lee wave which occurred over the Norwegian Mountains on January 25, 2000 during the first SOLVE campaign. The green area shows the terrain cross-section, while the black traces show MTP isentropes and the blue trace the DC-8 flight altitude. • . A. Dornbrack et al. , Evidence for inertia-gravity waves forming polar stratospheric clouds over Scandinavia, J. Geophys. Res., 107(D20), 8287, doi:10.1029/2001JD000452, 2002.