Download
1 / 25
250 likes | 408 Views
River Trail Middle School Data Overview. July 2011. Objective. Discover strengths and weakness in student performance to ultimately created a action-plan to improve student learning. RTMS Student demographic profile 8 th grade demographic profile 8 th Grade Georgia Writing Test Analysis

E N D
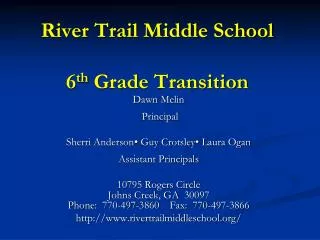
River Trail Middle SchoolData Overview July 2011
Objective • Discover strengths and weakness in student performance to ultimately created a action-plan to improve student learning. • RTMS Student demographic profile • 8th grade demographic profile • 8th Grade Georgia Writing Test Analysis • 8th Grade CRCT Score Analysis
Student Demographic Profile 2008-2011
RTMS Enrollment classified by Race 2008-2011
RTMS General Enrollments Information 2008-2011
Observations • Districting changed • White race is inaccurate (should be broken down farther.) • Black race enrollment is growing • School enrollment is going down • Free/reduced lunch population is growing
RTMS 8th Grade Demographic Profile 2006-2010
RTMS 8th Grade Enrollment by Race 2006-2010
RTMS 8th Grade Enrollment by Gender 2006-2010
Observations • Repeatedly more males than females • Special education program is decreasing • White race is inaccurate (needs to be broken down) • Multiracial population is growing
RTMS 8th grade Writing Exam compared to County, Metro, and State
Observations • Very few students don’t pass at RTMS • Regularly have high percentages of students exceeding the standard • Teachers conduct a writing work shop ever fall
RTMS 8th Grade CRCT Score Analysis 2006-2010
Reading CRCT RTMS 8th grade
Language Arts CRCT RTMS 8th grade
Math CRCT RTMS 8th grade
Social Studies CRCT RTMS 8th grade
Science CRCT RTMS 8th grade
Observations • Science has the highest percentage does not meet the standard • Science has the lowest percentage exceeding the standard • High percentage of students exceed the standard in all subjects
Conclusion • How can 8th grade science have less students not meeting the standard? • How can 8th grade science have more students exceeding the standard? • Diversity is changing at RTMS, how is this effecting test scores? • Are changing demographics effecting test scores?