Download
1 / 54
550 likes | 850 Views
Air Pressure and Wind. Chapter 19. 19.1 Understanding Air Pressure. Don’t notice change in your day to day activities Mostly cause-and-effect relationship Air pressure causes wind Wind brings change in temperature/humidity/precipitation. Air Pressure Defined.

E N D
Air Pressure and Wind Chapter 19
19.1 Understanding Air Pressure • Don’t notice change in your day to day activities • Mostly cause-and-effect relationship • Air pressure causes wind • Wind brings change in temperature/humidity/precipitation
Air Pressure Defined • The pressure exerted by the weight of air above • Sea level • 1kg/cm2 • Consider desk measuring 50cm X 100cm • That’s 5000cm2 • So pressure is 5000 kilograms • That’s equal to the mass of a 50 passenger school bus • Why doesn’t desk collapse? • Pressure is exerted in all directions • The air pushing down is balanced by air pushing up
Air Pressure Defined Example #2 • Imagine tall aquarium with same dimensions as desk • Fill with water to 10 meters • Water pressure at bottom is 1kg/cm • If placed on desk the desk will collapse • However, if you put desk inside aquarium and let it sink to bottom desk doesn’t collapse • Why? • Water pressure is exerted in all directions, not just down
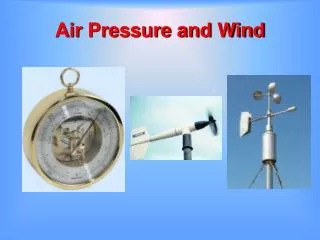
Measuring Air Pressure • Barometer • Use unit called millibar • Sea level = 1013.2 millibars • Might also hear “inches of mercury” • Toricelli • Invented mercury barometer • When air pressure increases, the mercury in the tube rises. When air pressure decreases, so does the height of the mercury column.
Measuring Air Pressure • Aneroid Barometer • Smaller and more portable • Has metal chamber with some air removed • Container changes shape • Compresses if pressure increases • Expands if pressure decreases • Connected to recording device • Gives continuous record of pressure over time
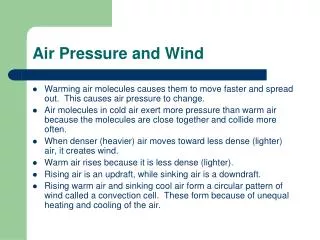
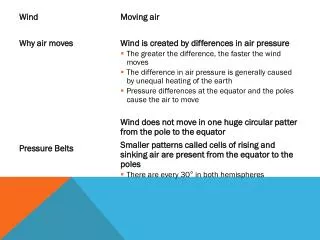
Factors Affecting Wind • Wind • The result of horizontal difference in air pressure • Air flows from high to low pressure • Pressure differences cause by unequal heating of Earth’s surface – all caused by the Sun • Three factors controlling wind • Pressure Differences • Coriolis Effect • Friction
FAW #1 – Pressure Differences • Wind flows high to low • Big difference means greater wind speed • Pressure gradient • Change in pressure over a given distance • Isobars • Lines on a map that connect equal pressures • Close together = steep gradient/high wind • Widely spaced = weak gradient/light wind
Isobar Activity - Objectives • You will use a black colored pencil to lightly draw lines connecting identical values of sea level pressure. • Remember, these lines, called isobars, do not cross each other. Isobars are usually drawn for every four millibars, using 1000 millibars as the starting point. Therefore, these lines will have values of 1000, 1004, 1008, 1012, 1016, 1020, 1024, etc., or 996, 992, 988, 984, 980, etc. • You will then identify a high pressure center and a low pressure center. • You will predict the location of fair weather and stormy weather. • You will identify the direction of spin around a high pressure center and a low pressure center.
Begin drawing from the 1024 millibars station pressure over Salt Lake City, Utah (highlighted in gray). Draw a line to the next 1024 value located to the northeast (upper right). Without lifting your pencil draw a line to the next 1024 value located to the south, then to the one located southwest, finally returning to the Salt Lake City value. • Now connect the pressure areas that are 1020 millibars. • Complete the map.
Labeling highs and lows • Isobars can be used to identify "Highs" and "Lows." The pressure in a high is greater than the surrounding air. The pressure in a low is lower than the surrounding air. • Label the center of the high pressure area with a large blue "H". • Label the center of the low pressure area with a large red "L".
Add the weather • High pressure regions are usually associated with dry weather because as the air sinks it warms and the moisture evaporates. Low pressure regions usually bring precipitation because when the air rises it cools and the water vapor condenses. • Shade, in green, the state(s) where you would expect to see rain or snow. • Shade, in yellow, the state(s) where you would expect to see clear skies.
Weather Rhyme • When pressure is low, expect rain or snow. • When pressure is high, look for a blue sky.
Put a spin on it • In the northern hemisphere the wind blows clockwise around centers of high pressure. The wind blows counterclockwise around lows. • Draw arrows around the "H" on your map to indicate the wind direction. • Draw arrows around the "L" on your map to indicate the wind direction.
FAW #2 – The Coriolis Effect • How Earth’s rotation affects moving objects. • Northern Hemisphere – deflected to right • Southern Hemisphere – deflected to left
FAW #2 – The Coriolis Effect • Deflection is always directed at right angles to the direction of air flow • Affects only wind direction – not wind speed • Is affected by wind speed • Stronger wind = greater deflection • Strongest at the poles and weakens toward equator • Becomes non-existent at equator
FAW #3 - Friction • Friction layer only affects first few kilometers of atmosphere • Slows air movement & affects wind direction • Jet Stream • Fast moving air near tropopause • Moves at right angle to isobars • Move 120-240km/hr from west to east • Unaffected by friction • Surface • Terrain causes wind to move slower and cross isobars at greater angles • Decreases Coriolis effect
19.1 Review • Why don’t objects such as a table collapse under the weight of air above them? • Suppose the height of a column in a mercury barometer is decreasing. What is happening? • What is the ultimate energy source for most wind? • How does the Coriolis effect influence motion of free-moving objects? • Why do jet streams flow parallel to isobars?
19.2 Pressure Centers and Wind • Cyclones = Low Pressure Centers • Cloudy • Precipitation • Pressure decreases from outer isobars toward center • Anticyclones = High Pressure Centers • Clear skies • Fair weather • Values of isobars increase toward center
Cyclonic and Anticyclonic Winds • Pressure Gradient and Coriolis Effect • Cause wind to move from high to low pressure and get deflected left or right by Earth’s rotation • Northern Hemisphere • Winds blow counterclockwise and into a low • Winds blow clockwise and away from a high • These are opposite in Southern Hemisphere • Friction • In either hemisphere net flow of air is inward around a cyclone and outward around anticyclone
Weather and Air Pressure • Rising Air • Cloud formation • Precipitation • Sinking Air • Clear skies
Weather and Air Pressure • Surface Low Pressure System • Air spiraling inward • Area occupied by air mass shrinks – horizontal convergence • Air squeezing together – can’t go into ground – must go up • To maintain low pressure - air aloft must diverge • Rising air causes cloud formation and precipitation • Surface High Pressure Systems • Just the opposite • Surface divergence with convergence aloft
Weather Forecasting • Emphasize location and paths of cyclones and anticyclones • The weather person will say high pressure systems and low pressure systems • Usually track lows because they are the precipitation makers • Generally travel west to east • Takes a few days or even a week to make it all the way across United States • Knowing their path helps us plan outdoor activities
Global Winds • Non-rotating planet with smooth surface • Two convection cells would form • Sun would heat most at equator and air would rise • Air would get to Poles and cool causing it to sink and flow back toward equator • Air aloft moves toward poles and surface air moves toward equator
Global Winds • Rotating Earth • Two cell convection system breaks into smaller cells • Polar and tropical cells act like two cell convection system but middle latitudes act differently
Global Winds • Hadley Cell • Near equator • Rising air produces equatorial low • 20-30 degrees N & S • Abundant precipitation • Rain forest • Subtropical High • 30 degrees N & S • Dry, sinking air • Deserts
Global Winds • Trade Winds • Air from subtropical high moving out • Headed toward equator • Deflected by Coriolis Effect • Blow constantly from East • Westerlies • Other half of air headed toward equator • Deflected in West to East motion
Global Winds • Polar Easterlies • Winds blown from polar high toward subpolar low • Not as constant as trade winds • This cold air meets warm air from Ferrell cell causing polar fronts
Global Winds • Four pressure zones • Subtropical High and Polar High • Dry sinking air • Flows outward at surface • Produces prevailing winds • Equatorial and Subpolar Lows • Air flows inward and upward • Clouds and precipitation
Influence of Continents • Land heats up and cools down quicker than water • When land masses are cold high pressure system develops • Causes air to move off land toward ocean • When land masses are warm low pressure develops • Air moves from ocean to land • Monsoons • Seasonal changes in wind direction
Intertropical Convergence Zone • Where the trade winds of the hemispheres meet • Average surface pressure and global circulation in July
19.2 Review • Describe how winds blow around pressure centers in the Northern Hemisphere. • Compare the air pressure for a cyclone with an anticyclone. • How does friction control the net flow of air around a cyclone and an anticyclone? • How does the atmosphere balance the unequal heating of the Earth’s surface? • In general, what type of weather can you expect if a low-pressure system is moving into your area?
Regional Wind Systems • Middle latitude circulation doesn’t fit with convection cell model • Westerlies interrupted by migrating cyclones and anticyclones • Move west to east in Northern Hemisphere
Local Winds • Produced by locally generated pressure gradient • Caused by topographic effects • Mountains vs Valleys • Caused by variation in surface composition • Land vs Sea
Sea Breezes • Warm summer days • Land heats more rapidly than water • Air above land heats, expands and rises • This creates low pressure system • Air over water remains at higher pressure • Air moves high to low so cool breeze comes in off ocean
Land Breezes • At night • Land cools faster than water • Cooling air sinks causing high pressure system • Air starts moving out to ocean/lake
Valley Breeze • Air along slope of mountain heated more than valley floor • Air is less dense so it moves up the slope and generates valley breeze • Often causes cumulus clouds to develop at mountain peaks
Mountain Breeze • After sunset air on slopes cools quicker than valley • Causes air to sink • Most dominant in winter
How Wind Is Measured • Direction and Speed • Labeled by direction from which they blow • North wind blows from north to south • East wind blows from east to west • Wind vanes point into the wind
Wind Direction • Prevailing wind • When wind consistently blows more often from one direction • Our wind generally moves west to east • Gets interrupted by high and low pressure systems that cause clockwise and counterclockwise flows • Direction can be reported as N, NE, S, SW, etc…. • Can be reported on scale of 00-3600 • 00 = North • 900 = East • 1800 = South • 2700 = West
Wind Speed • Anemometer • Faster wind speed causes faster turning • Read results on dial
El Nino and La Nina • Cold Peruvian current gets replaced for a few weeks per year by warmer water • Named “nino” after Christ child because it happens around Christmas
El Nino • Every 3-7 years warm currents become unusually strong • Sets off strange weather patterns • Warm water blocks upwelling of cold, nutrient filled water • Anchovies starve, then bigger fish starve and fishing industry gets devastated • Areas where it is usually dry get a lot of rain • High crop yields