Download
1 / 44
440 likes | 562 Views
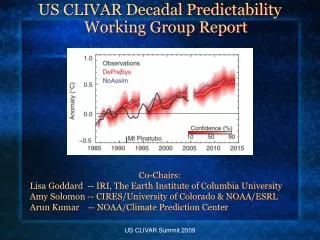
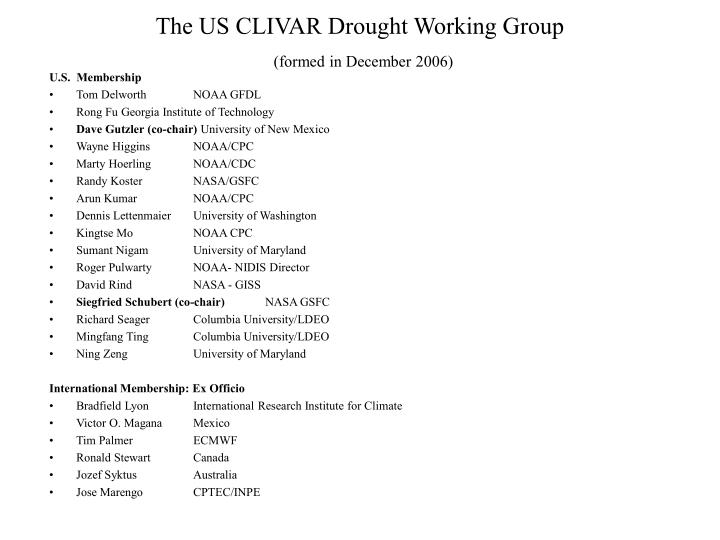
The US CLIVAR Drought Working Group (formed in December 2006). U.S. Membership Tom Delworth NOAA GFDL Rong Fu Georgia Institute of Technology Dave Gutzler (co-chair) University of New Mexico Wayne Higgins NOAA/CPC Marty Hoerling NOAA/CDC Randy Koster NASA/GSFC

E N D
The US CLIVAR Drought Working Group(formed in December 2006) U.S. Membership • Tom Delworth NOAA GFDL • Rong Fu Georgia Institute of Technology • Dave Gutzler (co-chair) University of New Mexico • Wayne Higgins NOAA/CPC • Marty Hoerling NOAA/CDC • Randy Koster NASA/GSFC • Arun Kumar NOAA/CPC • Dennis Lettenmaier University of Washington • Kingtse Mo NOAA CPC • Sumant Nigam University of Maryland • Roger Pulwarty NOAA- NIDIS Director • David Rind NASA - GISS • Siegfried Schubert (co-chair) NASA GSFC • Richard Seager Columbia University/LDEO • Mingfang Ting Columbia University/LDEO • Ning Zeng University of Maryland International Membership: Ex Officio • Bradfield Lyon International Research Institute for Climate • Victor O. Magana Mexico • Tim Palmer ECMWF • Ronald Stewart Canada • Jozef Syktus Australia • Jose Marengo CPTEC/INPE
Terms of Reference 1) Propose a working definition of drought and related model predictands of drought (developed model-based indices); 2) Coordinate evaluations of existing relevant model simulations (developed list of relevant simulations); 3) Suggest new experiments (coupled and uncoupled) designed to address some of the outstanding uncertainties mentioned above (carried out acoordinated set of experiments); 4) Coordinate and encourage the analysis of observational data sets to reveal antecedent linkages of multi-year drought (developed list of datasets); and 5) Organize a community workshop to present and discuss the results (joint with CDPW in October 2008) http://www.usclivar.org/Organization/drought-wg.html
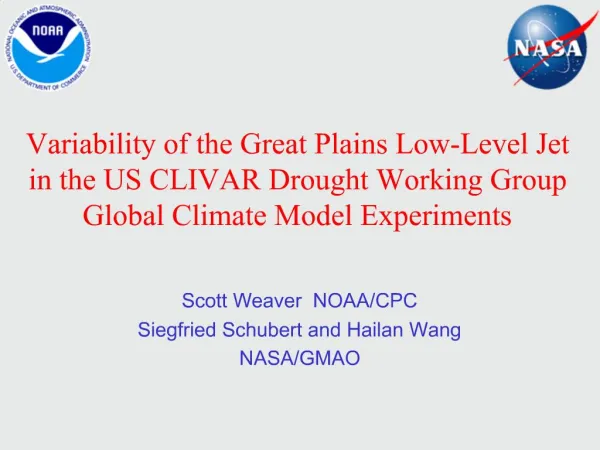
Coordinated Global Model Experiments Addressing the Role of SSTs and Soil Moisture in Regional Drought • The idea is that several modelling groups would do identical idealized experiments to address issues of model dependence on the response to SSTs (and the role of soil moisture), and to look in more detail at the physical mechanisms linking the SST changes to drought • All runs 50+ years, fixed SST patterns added to seasonally varying SST climatology • Participating groups/models: NASA (NSIPP1), Lamont(CCM3), NCEP(GFS), GFDL (AM2.1), NCAR (CAM3.5), and COLA/Univ. of Miami/ (CCM3.0)
SST Forcing • Leading patterns of annual mean SST variability • (base on on 1901-2004 HADISST) • Climatological SST (control run) • Separate patterns of low (decadal) and high (ENSO) SST variability • Tropics-only component of above SST forcing • Uniform SST warming • Fixed soil moisture • AMIP runs (provide link to observed variations)
Leading EOFs and Time series (annual mean SST - 1901-2004) Linear Trend Pattern (LT) Pacific Pattern (Pac) Atlantic Pattern (Atl)
Annual 200mb Height Anomalies (m) Pacific Warm Pacific Cold
Annual Tskin Anomalies (°C) Pacific Warm Pacific Cold
Annual 200mb Height Anomalies (m) Atlantic warm Atlantic cold
Annual Tskin Anomalies (°C) Atlantic warm Atlantic cold
Composite of the Atlantic Warm Pool (AWP) • ERSST from 1854-2006. • AWP variability is large. • Large AWPs are almost three times larger than the small ones. Courtesy Chunzai Wang NOAA AOML
The Caribbean Low-Level Jet (CLLJ) and Great Plains Low-Level Jet (GPLLJ) transport moisture from the AWP to the eastern North Pacific and the central United States, respectively. CLLJ GPLLJ Vertically integrated moisture flux in summer (JJA): Version 3.1; CAM3.1
Annual Precipitation (mm/day) Pacific Coldand Atlantic Warm Pacific Warm andAtlantic Cold
Multi Model Annual Mean response to idealized SST forcing Contours are the multi model mean and shading indicates where all model have the same sign anomaly. Multi model mean for Pacific and Atlantic responses include NSIPP, GFS, GFDL, CCM3, and CAM3.5 models. The linear trend response does not include CAM3.5 200 mb Height (m) Surface Temperature (K) Courtesy Phil Pegion NOAA/CPC
Precipitation (mm/day) Courtesy Phil Pegion NOAA/CPC
Pacific Warm Pacific Cold Annual Mean GP Precipitation (Y-axis) and Temperature (X-axis)
Atlantic Warm Atlantic Cold Annual Mean GP Precipitation (Y-axis) and Temperature (X-axis)
Land Impacts on Temperature During Drought T anomaly (JJA) during driest years minus mean T for control (PnAn) Mean T for experiment minus mean T for control (PnAn) T anomaly (JJA) during driest years minus mean T for experiment Courtesy Randy Koster NASA/GMAO impact of land-atmosphere feedback (strengthened or weakened) Total T anomaly during drought T change from climate shift ) ( = +
Land Impacts on Temperature During Drought T anomaly (JJA) during driest years minus mean T for control (PnAn) Mean T for experiment minus mean T for control (PnAn) T anomaly (JJA) during driest years minus mean T for experiment For PwAc, drastically reduced drought warming relative to control… impact of land-atmosphere feedback (strengthened or weakened) Total T anomaly during drought T change from climate shift …is due in part to a climate shift… ) ( = + …and in part to changes in the feedback character of the land surface.
Perpetual ENSO and Drought over the United States Kingtse Mo and Jae Schemm Climate Prediction Center NCEP/NWS/NOAA
ENSO composites • Project SSTA from 1915-2007 onto the first REOF for annual SSTA to obtain RPC • For each season, composites of SPI6, Soil moisture anomalies and SRI6 (for runoff) for warm and cold ENSO were formed when the RPC was greater (less) than one (negative) standard deviation. • Plot composite difference between cold and warm ENSO and average over 4 seasons together (Fig.1) • Drought: SPI6 < -0.8 and SRI6 < -0.8
ENSO Composites Cold-warm (Obs) Multi model ensemble Multi model ensemble captures the relationships between ENSO & drought over the United States
Conclusions • Drought is measured by persistent positive precipitation, soil moisture and runoff anomalies using indices SPI6, SRI6 and SM anomalies. • All indices indicate that drought is more likely to occur over the Southwest, and the Great Plains during cold ENSO. • The individual model experiment differs , but the multi model ensemble captures the relationships between ENSO and drought well
Evaluation of the links between SE US summer rainfall variability and SSTA simulated by NSIPP, GFDL AM2.0 and CCSM3(we do not have AMIP run for CCSM3.5) Courtesy Rong Fu Georgia Tech
How well can models reproduce the relationship between SE US summer rainfall anomalies (P) and N. tropical Atlantic SSTA? Observed NSIPP capture the observed correlation between Natl SSTA and P at 1- year period during early 80s and early 90s, but phase relation is not realistic. The correlation at 4-year scale is too strong in all three models compared to observation. Period (Year) 0o: in phase 90o: NAtl Leads PI 1980 1990 2000 GFDL AM2.1 CCM3 NSIPP
Great Plains Precipitation AnomalySeasonal precipitation anomalies smoothed by 12 applications of 1-2-1 averagingThe smoothed PRECIP index mimics PDSI (correlation of detrended series ~0.85) Simulation of 20th Century North American Hydroclimate Variability by the Drought Working Group Models Alfredo Ruiz-Barradas, Sumant Nigam, U of Maryland Full Century (1901-2002) Dust Bowl 1950s Drought Half Century (1950-2000) Full Century (1901-2002) Correlations [CRU_P, CCM3_P] =0.36 (0.37 detrend) [CRU_P, CAM3.5_P]=0.32 (0.33 detrend) [CRU_P, GFDLAM2.1_P]=0.26 (0.37 detrend) [CRU_P, PDSI] =0.82 (0.84 detrend) Half Century (1950-2000) Correlations [CRU_P, CCM3_P] =0.58 (0.50 detrend) [CRU_P, CAM3.5_P]=0.38 (0.19 detrend) [CRU_P, GFS_P] =0.28 (0.19 detrend) [CRU_P, GFDLAM2.1_P] =0.49 (0.46 detrend) [CRU_P, NSIPP_P] =0.27 (0.04 detrend)
SST Correlations of the Great Plains SummerPRECIP Indices (1950-2000)All-season precipitation indices are first detrended and then smoothed(as before) to generate PDSI proxies. The summertime proxy indices are then correlated with detrended SSTs. CRUTS2.1 CAM3.5 • GFS has fairly realistic correlations over the Pacific but not the Atlantic. • CCM3’s Pacific correlations are too strong, NSIPP’s too weak, and CAM3.5’s and GFDLAM2.1’s somewhere in between. • Atlantic links are comparable to the Pacific ones in observations but weaker in model simulations (with less accord among them as well). • CCM3 and CAM3.5 exhibit Indian Ocean connectivity, with little support from observations CCM3 GFS NSIPP The spread in models’ performance makes the CLIVAR Drought Modeling exercise worthwhile GFDLAM2.1
CMIP - Runs Courtesy Marty Hoerling (Link to Ben Kirtman’s Results)
Other Applications of the Runs • E.g., hurricanes
Summary • The USCLIVAR WG on drought is making progress on achieving its research goals to improve our understanding of long term regional drought • A series of coordinated global model experiments is providing important new information on the mechanisms (SST and soil moisture) that lead to long term regional drought including an assessment of model dependence • The idealized runs represent a substantial community investment in computing (thousands of years of simulation involving most of the major US modeling centers) • Initial results will be presented and discussed in a joint CDP and USCLIVAR workshop in October • The results of all the experiments will be made available in October of this year to the general community for analysis (some groups have already made their runs available)
Relevant Publications Schubert, S., R. Koster, M. Hoerling, R. Seager, D. Lettenmaier, A. Kumar, and D. Gutzler, 2007: Predicting Drought on Seasonal-to-Decadal Time Scales. Bull. Amer. Meteor. Soc., 88, 1625–1630 Gutzler, D. and S. Schubert, 2007: The U.S. CLIVAR Working Group on Long-Term Drought,”, U.S. CLIVAR Variations (Spring 2007, volume 5, No. 1). Drought WG +, 2008: A USCLIVAR Project to Assess and Compare the Responses of Global Climate Models to Drought-Related SST Forcing Patterns. Manuscript in preparation Schubert, S.D., M. J. Suarez, P. J. Pegion, R. D. Koster, H. Wang and J. T. Bacmeister, 2008: A mechanistic study of the impact of SSTs on drought and pluvial conditions over the United States. Manuscript in preparation. Wang, A., T. J. Bohn, D. P. Lettenmaier, S. Mahanama, and R. D. Koster, 2008: Multimodel ensemble reconstruction of drought over the continental United States. Manuscript in preparation. Koster, R. D., Z. Guo, P. A. Dirmeyer, R. Yang, and K. Mitchell, 2008: On the nature of soil moisture in land surface models. Manuscript in preparation Expect many more in the coming months on model results …
For cold ENSO, all indices show: Dryness over the Southwest, areas along the Gulf of Mexico and Great Plains For warm ENSO, the situation reverses Fig .1: composites based on the ENSO Pacific SST pattern
Procedures to analyze model runs • Pool all monthly mean P together from all 9 experiments for a given model. • Calculate 6 month standardized precipitation index (SPI6). For drought, the 6-month SPI needed to be less than -0.8. • For each experiment, we count the number of months (num) that SPI6 indicates drought. Obtain percentile by dividing num by the total months of the experiment. • Multi model ensemble : Average of four models (GFS,NSIPP,CCM3 and GFDL) for each experiment. • The statistical significant test was done using the Monte Carlo method.
For wPna: The ensemble shows that there are less drought events over the Southwest, Great Plains For cPna: There are more drought events over the above areas Fig.2 Ensemble: percentile of the number of months under drought averaged over GFS, NSIPP, CCM3 and GFDL.
0o: in phase 90o: Nino Leads PI How well can models AMIP runs reproduce the relationship between SE US summer rainfall anomalies (P) and Nino? Correlation coefficient Joint wavelet coherence: NSIPP and GFDLAM2.1 capture the observed correlation between Nino34 (lead) and SE US summer rainfall variability of 0.5-1 year period during mid 80s and early 90s. ENSO forcing on P seems to be too strong and too persistent in all models. Only NSIPP shows decadal variability of P-NINO34 correlation. Observed Period (Year) 1980 1990 2000 GFDL AM2.1 CCM3 NSIPP
NCAR Community Atmospheric Model (Version 3.1; CAM3.1) • A global spectral model (T42 with 26 vertical layers; equivalent to a 2.8°2.8° horizontal resolution). • SST from the Hadley Centre (UK) as the model-forcing. • The control (CTRL) ensemble (with 18 members) run: Climatological SST is prescribed globally. • The large AWP (LAWP) ensemble run: SST composite for large AWP is used in the AWP region. • The small AWP (SAWP) ensemble run: SST composite for small AWP is used in the AWP region. • The difference is taken between the LAWP and SAWP runs.
Impact of the AWP on North Atlantic Subtropical High (NASH) SLP’s response to AWP variability in JJA The AWP weakens the NASH (especially at its southwestern edge) and strengthens summer continental low over the North American monsoon region.
Impact of the AWP on Rainfall during Summer (JJA) Precipitation response to AWP variability Large (small) AWP decreases (increases) rainfall in the United States east of the Rocky Mountains, in agreement with observations.
Simulation of 20th Century North American Hydroclimate Variability by the Drought Working Group Models Objective: Assess capabilities of the DWG atmospheric models in simulating seasonal and low-frequency summer hydroclimate variability over North America Models examined: NSIPP (NASA/GSFC; 2.5lon x 2.0lat, 5th AMIP ens mem, 1930-2004) CCM3 (LDEO; T-42 goga_new runs atm, 1st ens mem, 1856-2007) CAM3.5 (NCAR; T-85, one run completed recently, 1871-2006) GFS (NOAA/NCEP; T62L64 version of current CFS, 1950-2001) AM2.1 (NOAA/GFDL; 144x90, 7th AMIP ens mem, 1870-1999) Alfredo Ruiz-Barradas and Sumant Nigam University of Maryland