Download
1 / 57
570 likes | 660 Views
CrossGrid: Interactive Applications, Tool Environment, New Grid Services, and Testbed. Marian Bubak X# TAT Institute of Computer Science & ACC CYFRONET AGH, Cracow, Poland www.eu-crossgrid.org. Overview. Applications and their requirements X# architecture

E N D
CrossGrid: Interactive Applications, Tool Environment, New Grid Services, and Testbed Marian Bubak X# TAT Institute of Computer Science & ACC CYFRONET AGH, Cracow, Poland www.eu-crossgrid.org
Overview • Applications and their requirements • X# architecture • Tools for X# applications development • New grid services • Structure of the X# Project • Status and future
CrossGrid in a Nutshell Interactive and Data Intensive Applications • Interactive simulation and visualization of a biomedical system • Flooding crisis team support • Distributed data analysis in HEP • Weather forecast and air pollutionmodeling Grid Application Programming Environment • MPI code debugging and verification • Metrics and benchmarks • Interactive and semiautomatic performance evaluation tools Grid Visualization Kernel HLA Data Mining New CrossGrid Services DataGrid ... • Portals and roaming access • Grid resource management • Grid monitoring • Optimization of data access Services Globus Middleware Fabric
Biomedical Application • Input: 3-D model of arteries • Simulation: LB of blood flow • Results: in a virtual reality • User: analyses results in near real-time, interacts, changes the structure of arteries
Steering in the Biomedical Application CT / MRI scan Segmentation Visualization LB flow simulation Medical Medical HDB VE DB DB WD PC PDA 10 simulations/day 60 GB 20 MB/s Interaction
Modules of the Biomedical Application • Medical scanners - data acquisition system • Software for segmentation – to get 3-D images • Database with medical images and metadata • Blood flow simulator with interaction capability • History database • Visualization for several interactive 3-D platforms • Interactive measurement module • Interaction module • User interface for coupling visualization, simulation, steering
the user can adjust simulation parameters while the simulation is running Interactive Steering in the Biomedical Application CT / MRI scan Segmentation Visualization LB flow simulation Medical Medical HDB VE DB DB WD PC PDA Interaction
Biomedical Application Use Case (1/3) CT / MRI scan Segmentation LB flow • Obtaining an MRI scan for the patient • Image segmentation(clear picture of important blood vessels, location of aneurisms and blockages) • Generation of a computational mesh for a LB simulation • Start of a simulation of normal blood flow in the vessels simulation Medical Medical DB DB
Biomedical Application Use Case (2/3) • Generation of alternative computational meshes (several bypass designs) based on results from the previous step • Allocation of appropriate Grid resources (one cluster for each computational mesh) • Initialization of the blood flow simulations for the bypasses • The physician can monitor the progress of the simulations through his portal • Automatic completion notification, (e.g. through SMS messages.
Biomedical Application Use Case (3/3) • Online presentation of simulation results via a 3D environment • Adding small modifications to the proposed structure (i.e. changes in angles or positions) • Immediate initiation of the resulting changes in the blood flow • The progress of the simulation and the estimated time of convergence should be available for inspection. Visualization LB flow simulation VE WD PC PDA Interaction
Data sources meteorological radars • External sources of information • Global and regional centers GTS • EUMETSAT and NOAA • Hydrological services of other countries surface automatic meteorological and hydrological stations systems for acquisition and processing of satellite information Storage systems databases High performance computers Grid infrastructure meteorological models hydrological models hydraulic models Users Flood crisis teams • river authorities • energy • insurance companies • navigation • meteorologists • hydrologists • hydraulic engineers • media • public FloodingCrisis Team Support
Cascade of Flood Simulations Data sources Meteorological simulations Hydrological simulations Users Hydraulic simulations Output visualization
Basic Characteristics of Flood Simulation • Meteorological • intensive simulation (1.5 h/simulation) – maybe HPC • large input/output data sets (50MB~150MB /event) • high availability of resources (24/365) • Hydrological • Parametric simulations - HTC • Each sub-catchment may require different models (heterogeneous simulation) • Hydraulic • Many 1-D simulations - HTC • 2-D hydraulic simulations need HPC
Váh River Pilot Site Nosice (Outflow point) Strečno (Inflow point) Pilot Site Catchment Area: 2500km2 (above Strečno: 5500km2) Váh River Catchment Area: 19700km2, 1/3 of Slovakia
Distributed Data Analysis in HEP • Objectives • Distributed data access • Distributed data mining techniques with neural networks • Issues • Typical interactive requests will run on o(TB) distributed data • Transfer/replication times for the whole data of order of one hour • Data transfers once and in advance of the interactive session. • Allocation, installation and set up the corresponding database servers before the interactive session starts
Weather Forecast and Air Pollution Modeling • Distributed/parallel codes on Grid • Coupled Ocean/Atmosphere Mesoscale Prediction System • STEM-II Air Pollution Code • Integration of distributed databases • Data mining applied to downscaling weather forecast
COAMPS Coupled Ocean/Atmosphere Mesoscale Prediction System:Atmospheric Components • Complex Data Quality Control • Analysis: • Multivariate Optimum Interpolation Analysis (MVOI) of Winds and Heights • Univariate Analyses of Temperature and Moisture • OI Analysis of Sea Surface Temperature • Initialization: • Variational Hydrostatic Constraint on Analysis Increments • Digital Filter • Atmospheric Model: • Numerics: Nonhydrostatic, Scheme C, Nested Grids, Sigma-z, Flexible Lateral BCs • Physics: PBL, Convection, Explicit Moist Physics, Radiation, Surface Layer • Features: • Globally Relocatable (5 Map Projections) • User-Defined Grid Resolutions, Dimensions, and Number of Nested Grids • 6 or 12 Hour Incremental Data Assimilation Cycle • Can be Used for Idealized or Real-Time Applications • Single Configuration Managed System for All Applications • Operational at FNMOC: • 7 Areas, Twice Daily, using 81/27/9 km or 81/27 km grids • Forecasts to 72 hours • Operational at all Navy Regional Centers (w/GUI Interface)
Air Pollution Model – STEM-II • Species: 56 chemical, 16 long-lived, 40 short-lived, 28 radicals (OH, HO2 ) • Chemical mechanisms: • 176 gas-phase reactions • 31 aqueous-phase reactions. • 12 aqueous-phase solution equilibria. • Equations are integrated with locally 1-D finite element method (LOD-FEM) • Transport equations are solved with Petrov-Crank-Nicolson-Galerkin (FEM) • Chemistry & mass transfer terms are integrated with semi-implicit Euler and pseudo-analytic methods
Key Features of X# Applications • Data • Data generators and data bases geographically distributed • Selected on demand • Processing • Needs large processing capacity; both HPC & HTC • Interactive • Presentation • Complex data require versatile 3D visualisation • Support interaction and feedback to other components
Overview of the CrossGrid Architecture Applications 1.1 BioMed 1.2 Flooding 1.3 Interactive Distributed Data Access 1.3 Data Mining on Grid (NN) 1.4 Meteo Pollution 2.2 MPI Verification 2.3 Metrics and Benchmarks 2.4 Performance Analysis 3.1 Portal & Migrating Desktop Supporting Tools Applications Development Support MPICH-G 1.1, 1.2 HLA and others App. Spec Services 1.1 User Interaction Services 1.1 Grid Visualisation Kernel 3.2 Scheduling Agents 3.4 Optimization of Grid Data Access 3.3 Grid Monitoring 3.1 Roaming Access DataGrid Replica Manager Globus Replica Manager Generic Services DataGrid Job Submission Service GRAM GridFTP GIS / MDS GSI Globus-IO Replica Catalog Replica Catalog Fabric Resource Manager (CE) Resource Manager (SE) Resource Manager Resource Manager 3.4 Optimization of Local Data Access CPU Secondary Storage Instruments ( Satelites, Radars) Tertiary Storage
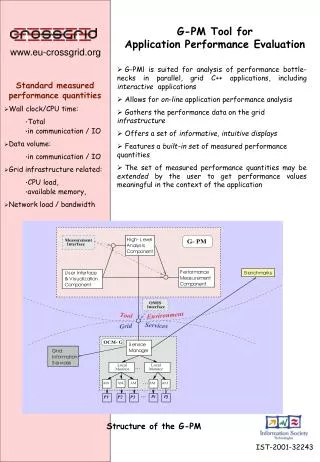
Benchmarks (Task 2.3) G-PM High Level Analysis Component Applications (WP1) executing on Grid testbed RMD PMD Grid Monitoring (Task 3.3) Performance Measurement Component User Interface and Visualization Component Performance Prediction Component Application source code Legend RMD – raw monitoring data PMD – performance measurement data data flow Tool Environment manual information transfer
MPIVerification • A tool that verifies the correctness of parallel,distributed Grid applications using the MPI paradigm. • To make end-user applications • portable, • reproducible, • reliable on any platform of the Grid. • The technical basis: MPI profiling interface which allows a detailed analysis of the MPI application
Benchmark Categories • Micro-benchmarks • For identifying basic performance properties of Grid services, sites, and constellations • To test a single performance aspect, through “stress testing” of a simple operation invoked in isolation • The metrics captured represent computing power (flops), memory capacity and throughput, I/O performance, network ... • Micro-kernels • “Stress-test” several performance aspects of a system at once • Generic HPC/HTC kernels, including general and often-used kernels in Grid environments • Application kernels • Characteristic of representative CG applications • Capturing higher-level metrics, e.g. completion time, throughput, speedup.
Performance Measurement Tool G-PM • Components: • performance measurement component (PMC), • component for high level analysis (HLAC), • component for performance prediction (PPC) based on analytical performance models of application kernels, • user interface and visualization component UIVC.
For Interactive X# Applications ... • Resource allocation should be done in near-real time (a challenge for the resource broker & scheduling agents). • The resource reservation (i.e. by prioritizing jobs) • Network bandwidth reservation (?) • Near-real time synchronization between visualization and simulation should be achieved in both directions: user to simulation and simulation to user (rollback etc) • Fault tolerance • Post-execution cleanup
Scheduler (3.2) Resource Resource Resource Resource Broker Broker Condor Condor - - G G Nimrod Nimrod Broker Broker Condor Condor - - G G Nimrod Nimrod User Interaction Service user site Service Factory User Interaction User Interaction User Interaction CM for Sim 1 Services Services Services User Interaction User Interaction User Interaction User Interaction Services Service Services Services CM for Sim 2 CM CM CM CM CM for Sim 3 CM Visualisation In VE Running Simulation 3 Running Simulation 1 Running Simulation 2 CM UIS connections Pure module UIS service Other connections Control module
Tools Environment and Grid Monitoring Applications Portals (3.1) MPI Debugging and Verification (2.2) G-PM Performance Measurement Tools (2.4) Metrics and Benchmarks (2.4) Grid Monitoring (3.3) (OCM-G, RGMA) Application programming environment requires information from the Grid about current status of applications and it should be able to manipulate them
Monitoring of GridApplications • Monitor = obtain information on or manipulate target application • e.g. read status of application’s processes, suspend application, read / write memory, etc. • Monitoring module needed by tools • Debuggers • Performance analyzers • Visualizers • ...
Very Short Overview of OMIS • Target system view • hierarchical set of objects • nodes, processes, threads • For the Grid: new objects – sites • objects identified by tokens, e.g. n_1, p_1, etc. • Three types of services • information services • manipulation services • event services
OMIS Services • Information services • obtain information on target system • e.g. node_get_info = obtain information on nodes in the target system • Manipulation services • perform manipulations on the target system • e.g. thread_stop = stop specified threads • Event services • detect events in the target system • e.g. thread_started_libcall = detect invocations of specified functions • Information + manipulation services = actions
Components of OCM-G • Service Managers • one per site in the system • permanent • request distribution • reply collection • Local Monitors • one per [node, user] pair • transient (created or destroyed when needed) • handle local objects • actual execution of requests
Monitoring Environment • OCM-G Components • Service Managers • Local Monitors • Application processes • Tool(s) • External name service • Component discovery
Security Issues • OCM-G components handle multiple users, tools and applications • possibility to issue a fake request (e.g., posing as a different user) • authentication and authorization needed • LMs are allowed for manipulations • unauthorized user can do anything
Portals and Roaming Access Applications Portals (3.1) • Remote Access Server • user profiles • authentication, authorization • job submission • Migrating Desktop • Application portal Scheduler (3.2) Roaming Access Server (3.1) Grid Monitoring (3.3) GIS / MDS (Globus) • Allow access userenvironment from remote computers • Independent of the system version and hardware • Run applications, manage data files, store personal settings
Optimization of Grid Data Access • Different storage systems and applications’ requirements • Optimization by selection of data handlers Applications Portals (3.1) Scheduling Agents (3.2) Optimization of Grid Data Access (3.4) • Service consists of • Component-expert system • Data-access estimator • GridFTP plugin Replica Manager (DataGrid / Globus) Grid Monitoring (3.3) GridFTP
CrossGrid Collaboration Ireland: TCD Dublin Poland: Cyfronet & INP Cracow PSNC Poznan ICM & IPJ Warsaw Germany: FZK Karlsruhe TUM Munich USTU Stuttgart Netherlands: UvA Amsterdam Slovakia: II SAS Bratislava Austria: U.Linz Spain: CSIC Santander Valencia & RedIris UAB Barcelona USC Santiago & CESGA Greece: Algosystems Demo Athens AuTh Thessaloniki Portugal: LIP Lisbon Italy: DATAMAT Cyprus: UCY Nikosia
WP1 – CrossGrid Application Development Tasks 1.0 Co-ordination and management (Peter M.A. Sloot, UvA) 1.1 Interactive simulation and visualisation of a biomedical system (G. Dick van Albada, Uva) 1.2 Flooding crisis team support (Ladislav Hluchy, II SAS) 1.3 Distributed data analysis in HEP (C. Martinez-Rivero, CSIC) 1.4 Weather forecast and air pollution modelling (Bogumil Jakubiak, ICM)
WP2 - Grid Application Programming Environments Tasks 2.0 Co-ordination and management (Holger Marten, FZK) 2.1 Tools requirement definition (Roland Wismueller, TUM) 2.2 MPI code debugging and verification (Matthias Mueller, USTUTT) 2.3 Metrics and benchmarks (Marios Dikaiakos, UCY) 2.4 Interactive and semiautomatic performance evaluation tools (Wlodek Funika, Cyfronet) 2.5 Integration, testing and refinement (Roland Wismueller, TUM)
WP3 – New Grid Services and Tools Tasks 3.0 Co-ordination and management (Norbert Meyer, PSNC) 3.1 Portals and roaming access (Miroslaw Kupczyk, PSNC) 3.2 Grid resource management (Miquel A. Senar, UAB) 3.3 Grid monitoring (Brian Coghlan, TCD) 3.4 Optimisation of data access (Jacek Kitowski, Cyfronet) 3.5 Tests and integration (Santiago Gonzalez, CSIC)
WP4 - International Testbed Organization • Tasks • 4.0 Coordination and management • (Jesus Marco, CSIC, Santander) • Coordination with WP1,2,3 • Collaborative tools • Integration Team • 4.1 Testbed setup & incremental evolution • (Rafael Marco, CSIC, Santander) • Define installation • Deploy testbed releases • Trace security issues • Testbed site responsibles: • CYFRONET (Krakow) A.Ozieblo • ICM(Warsaw) W.Wislicki • IPJ (Warsaw) K.Nawrocki • UvA (Amsterdam) D.van Albada • FZK (Karlsruhe) M.Kunze • IISAS (Bratislava) J.Astalos • PSNC(Poznan) P.Wolniewicz • UCY (Cyprus) M.Dikaiakos • TCD (Dublin) B.Coghlan • CSIC (Santander/Valencia) S.Gonzalez • UAB (Barcelona) G.Merino • USC (Santiago) A.Gomez • UAM (Madrid) J.del Peso • Demo (Athenas) C.Markou • AuTh (Thessaloniki) D.Sampsonidis • LIP (Lisbon) J.Martins
WP4 - International Testbed Organization • Tasks • 4.2Integration with DataGrid (Marcel Kunze, FZK) • Coordination of testbed setup • Exchange knowledge • Participate in WP meetings • 4.3 Infrastructure support (Josep Salt, CSIC, Valencia) • Fabric management • HelpDesk • Provide Installation Kit • Network support • 4.4 Verification & quality control (Jorge Gomes, LIP) • Feedback • Improve stability of the testbed
CrossGrid Testbed Map Géant TCD Dublin PSNC Poznan UvA Amsterdam ICM & IPJ Warsaw FZK Karlsruhe CYFRONET Cracow CSIC-UC IFCA Santander II SAS Bratislava USC Santiago LIP Lisbon Auth Thessaloniki UAB Barcelona CSIC RedIris Madrid CSIC IFIC Valencia DEMO Athens UCY Nikosia
WP5 – Project Management Tasks 5.1 Project coordination and administration (Michal Turala, INP) 5.2 CrossGrid Architecture Team (Marian Bubak, Cyfronet) 5.3 Central dissemination (Yannis Perros, ALGO)
-Links with European National efforts - Links with US projects (GriPhyN, PPDG, iVDGL,…) Applications EGSO CROSSGRID GRIA EUROGRID DATAGRID GRIP GRIDLAB DAMIEN Middleware & Tools DATATAG Underlying Infrastructures Industry / business Science EU Funded Grid Project Space (Kyriakos Baxevanidis)
Project Phases M 4 - 12: first development phase: design, 1st prototypes, refinement of requirements M 25 -32: third development phase: complete integration, final code versions M 33 -36: final phase: demonstration and documentation M 1 - 3: requirements definition and merging M 13 -24: second development phase: integration of components, 2nd prototypes
Rules for X# SW Development • Iterative improvement: • development, testing on testbed, evaluation, improvement • Modularity • Open source approach • SW well documented • Collaboration with other # projects