Download
1 / 26
260 likes | 409 Views
Ch. 2 Population. Section #1 “People are not distributed uniformly across Earth’s surface .”. Where Is the World’s Population Distributed?. REVIEW: Population Concentrations 2/3 of the world’s inhabitants are clustered in four regions. Site and Situation of Population Clusters

E N D
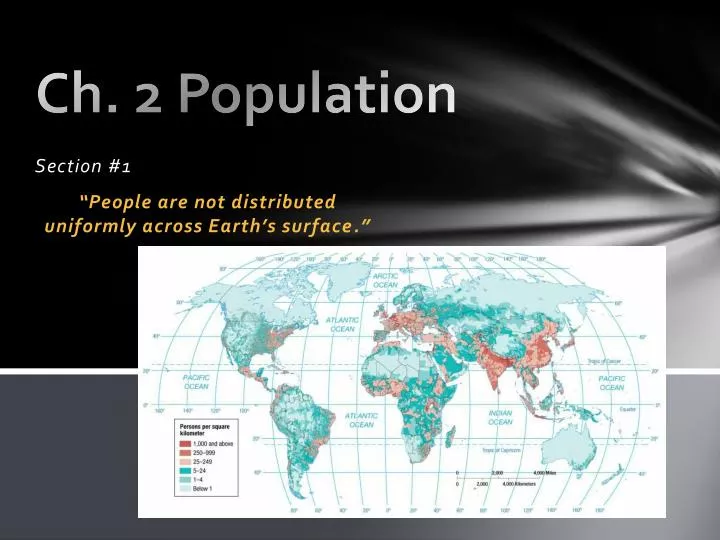
Ch. 2 Population Section #1 “People are not distributed uniformly across Earth’s surface.”
Where Is the World’s Population Distributed? • REVIEW: Population Concentrations • 2/3 of the world’s inhabitants are clustered in four regions. • Site and Situation of Population Clusters • Low-lying areas with fertile soil and temperate climate • Near an ocean or near a river with easy access to an ocean. • East Asia- China(River Valley) • ¼ of world population • South Asia- India(Ganges River) • Southeast Asia- Indonesia • Europe- Major Rivers
Where Is the World’s Population Distributed? • Sparsely Populated Regions • Humans avoid clustering in certain physical environments. • Dry Lands • Wet Lands • Cold Lands • High Lands • Places considered too harsh for occupancy have diminished over time. • Places of permanent human settlement are termed the ecumene.
Population DensityHelps Geographers describe the distribution of people in comparison of recourses. • Density can be computed in up to three ways for a place. • Arithmetic Density • Physiological Density • Agricultural Density
Arithmetic Density*Total number of objects in an given area*Computation: Divide the population by the land areaThink about: # people trying to live on a given piece of land
Physiological Density*Number of people supported by a unit area of arable land*Computation: Divide the population by the arable land area*Think about: Does the land give enough food for needs
Agricultural Density*Ratio of the number of farmers to amount of arable land*Computation: Divide the population of farmers by the arable land area*Explains economic differences
Why Is Global Population Increasing? • Components of Population Growth • Geographers measure population change in a country or the world as a whole by using three measures: • 1. Crude Birth Rate (CBR)– total number of live birth in a year for every 1,000 people alive in society. • 2. Crude Death Rate (CDR) – total number of deaths in a year for every 1,000 people alive in society. • 3. Natural Increase Rate (NIR)– percentage by which a population grows in a year.
Computation: CBR – CDR = NIR • Remember NIR is a percentage ( n per 100, while CBR and CDR are expressed as n per 1,000) • Why “Natural”? Excludes migration • Video • http://www.youtube.com/watch?v=WY6FZjBC1kc
Components of Population Growth • Example: • Natural Increase • About 82 million people are added to the population of the world annually. • Rate of natural increase affects the doubling time– number of years needed to double the population, assuming a constant rate of natural increase. • Calculating Doubling Time: 70/NIR=Time • Twenty-First Century Rate (1.2 percent): 54 years • Global population in 2100 would reach 24 billion.
World average= 1.2 percentHighest in Africa and SW AsiaLowest in Europe and JapanWHY?
Components of Population Growth • Fertility-Total Fertility Rate (TFR) • Defined as the average number of children a woman will have throughout her childbearing years (15–49) • TFR for world is 2.5. • TFR exceeds 5 in sub-Saharan Africa, while 2 or less in nearly all European countries. WHY?
Mortality-Infant Mortality Rate (IMR) • Defined as the annual number of deaths of infants under one year of age, compared with total live births • Usually expressed per 1,000 births rather than a percentage • IMR is 5 in developed countries and 80 in sub-Saharan Africa. • WHY?
Summary of Spatial Patterns • Developed Countries • Lower rates of… • Natural increase • Crude birth • Total fertility • Infant mortality • Developing Countries • Higher rates of… • Natural increase • Crude birth • Total fertility • Infant mortality Video: http://www.youtube.com/watch?v=qb-3Ri5G2j4
Population Structure • A special bar graph known as a population pyramid can visually display a country’s distinctive population structure. • X-axis • Percent male displayed to the left of zero • Percent female displayed to the right of zero • Y-axis • Age cohorts typically grouped in 5-year intervals • Youngest displayed at bottom and oldest at top
Population Pyramid2 Main Features • Dependency Ratio • Number of people who are too young or too old to work, compared to the number of people in their productive years. • People aged to 14 and over 65 years old are considered dependents. • Larger dependency ratios imply greater financial burden on the working class. • Calculate: % under 15 + % over 65/ % aged 15 – 64 x 100 • 85 percent in sub-Saharan Africa, while 47 percent in Europe. • Sex Ratio • Number of males per 100 females in the population • Developed countries have more females than males, because they tend to live 7 years longer.
Population Pyramids for Poor Countries • -High infant mortality -High Youth Dependency +Youthful Pop-Creativity • -Short life expectancy -Strain on Resources +Less Elder Dependency • -Fewer Women Educated +Large Workforce
Population Pyramids for Wealthy Countries • +Low infant mortality -High Elder Dependency Rate • +Long life expectancy -Possible labor storages • +Educated Workforce +Low youth dependency rate • +More Females then Males