Download
1 / 35
350 likes | 542 Views
Review: Classes 1 - 3. Objective of Business. Intro. Prisoners’ Dilemma (Game Theory intro) What is Strategy? IBP: Cost strategy, KSF changed, Constraints on options .

E N D
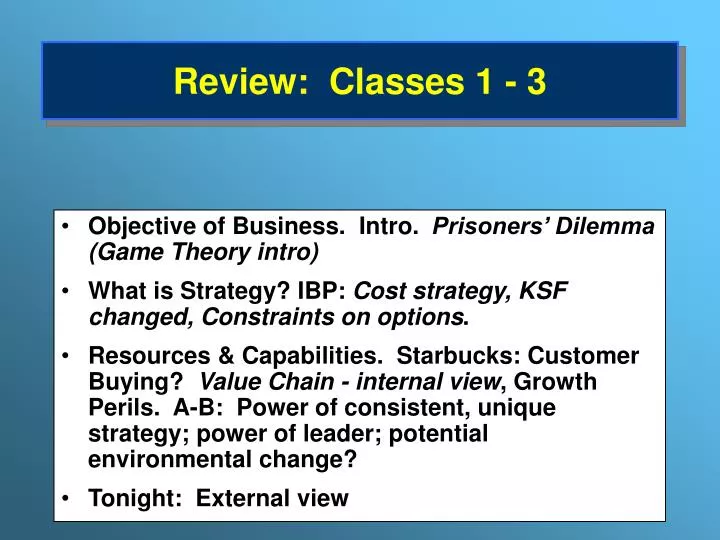
Review: Classes 1 - 3 • Objective of Business. Intro. Prisoners’ Dilemma (Game Theory intro) • What is Strategy? IBP: Cost strategy, KSF changed, Constraints on options. • Resources & Capabilities. Starbucks: Customer Buying? Value Chain - internal view, Growth Perils. A-B: Power of consistent, unique strategy; power of leader; potential environmental change? • Tonight: External view
From Environmental Analysis to Industry Analysis Context: PEST The natural environment The national/ international economy • THE INDUSTRY • ENVIRONMENT • Company TJB • Suppliers X TJB • Competitors • Customers Demographic structure Technology Government & Politics Social structure Social structure • The Industry Environment lies at the core of the Macro Environment. • The Macro Environment impacts the firm through its effect on the Industry • Environment.
The Spectrum of Industry Structures Perfect Competition Oligopoly Duopoly Monopoly Concentration Many firms A few firms Two firms One firm Entry and Exit Barriers No barriers Significant barriers High barriers Product Differentiation Homogeneous Product Potential for product differentiation Information Perfect Information flow Imperfect availability of information
Porter’s Five Forces of Competition ** Framework SUPPLIERS Bargaining power of suppliers INDUSTRY COMPETITORS Threat of substitutes Threat of new entrants POTENTIAL ENTRANTS SUBSTITUTES Rivalry among existing firms Bargaining power of buyers Book BUYERS
Threat of Substitutes Extent of competitive pressure from producers of substitutes depends upon: • Buyers’ propensity to substitute • The price-performance characteristics of substitutes. My worksheet
The Threat of Entry Entrants’ threat to industry profitability depends upon the height of barriers to entry. The principal sources of barriers to entry are: • Capital requirements • Economies of scale • Absolute cost advantage • Product differentiation • Access to channels of distribution • Legal and regulatory barriers • Retaliation
Bargaining Power of Buyers Buyer’s price sensitivity Relative bargaining power • Cost of purchases as % • of buyer’s total costs. • How differentiated is the • purchased item? • How intense is • competition between • buyers? • How important is the • item to quality of the • buyers’ own output? • Size and concentration of • buyers relative to • sellers. • Buyer’s information . • Ability to backward • integrate. Note: analysis of supplier power is symmetric
Rivalry Between Established Competitors The extent to which industry profitability is depressed by aggressive price competition depends upon: • Concentration (number and size distribution of firms) • Diversity of competitors (differences in goals, cost structure, etc.) • Product differentiation • Excess capacity and exit barriers • Cost conditions • Extent of scale economies • Ratio of fixed to variable costs
Figure 3.5. The Impact of Growth on Profitability Market Growth Less than -5% -5% to 0 0 to 5% 5% to 10% Over 10% Surprised?
Applying Five - Forces Analysis Forecasting Industry Profitability • Past profitability a poor indicator of future profitability. TJB - ?? PharmDrugs v Steel, Airlines • If we can forecast changes in industry structure we can predict likely impact on competition and profitability. • Strategies to Improve Industry Profitability • What structural variables are depressing profitability • Which can be changed by individual or collective strategies? POA
Industry EVA/CE MV/CE ROA Tobacco 0.0936 3.2314 14.3979 Computer Software & Services 0.0590 4.0331 10.3530 Entertainment 0.0442 2.8240 8.4403 Personal Care 0.0281 2.8700 8.005 Medical Products 0.0276 3.0987 9.5384 Food Processing 0.0251 1.7090 8.5306 IT Consulting Services 0.0206 2.7136 6.5260 Drugs & Research 0.0065 3.3807 7.6439 Chemicals 0.0029 1.8195 7.9589 Beverages 0.0018 2.1688 5.5960 Eating Places 0.0014 2.3246 6.8867 Textiles -0.0012 1.9392 7.4093 Building Materials -0.0056 1.5521 5.6250 Metals -0.0101 1.7447 - Telephone Companies -0.0124 1.3680 4.6181 Semiconductors & Components -0.0126 2.0560 5.9906 Aluminium -0.0128 1.4844 - Paper & Products -0.0149 1.2902 5.2342 Broadcasting & Publishing -0.0149 1.8042 6.0059 Cars & Trucks -0.0150 0.9473 2.1660 Computers & Peripherals -0.0306 1.7332 3.1143 Electrical Products -0.0327 1.3056 4.6276 Aerospace & Defence -0.0331 1.3982 4.8390 Railroads -0.0340 1.0257 3.7780 Airlines -0.0416 1.1676 0.9866 Construction & Engineering -0.0458 1.6749 - Steel -0.0647 1.2967 2.2646 Mean (all industries) -0.0110 1.8930 5.5989 US Industrial Profitability, 1986-97: EVA, Market Value Added, and ROA
Industry 5 Industry 1 Industry 2 Industry 3 Industry 4 X Plant is first entry into the Y Industry Market Attractiveness & Competitive Strength for various ZZZ markets High Med. Market Attractiveness How much Profit is there to be made? Low Strong Average Weak Competitive Strength: What % of profit can WE make? Sector
Drawing Industry Boundaries : Identifying the Relevant Market • What industry is BMW in: • World Auto industry • European Auto industry • World luxury car industry? • Key criterion: SUBSTITUTABILITY • On the demand side : are buyers willing to substitute between types of cars and across countries • On the supply side : are manufacturers able to switch production between types of cars and across countries • May need to analyze industry at different levels for different types of decision
The Value Net CUSTOMERS COMPETITORS COMPANY COMPLEMENTORS SUPPLIERS Book. Complexity & Tools
Five Forces or Six? Introducing Complements The suppliers of complements create value for the industry and can exercise bargaining power SUPPLIERS Bargaining power of suppliers INDUSTRY COMPETITORS COMPLEMENTS Threat of new entrants POTENTIAL ENTRANTS Threat of substitutes SUBSTITUTES Rivalry among existing firms Bargaining power of buyers BUYERS
Dynamic Competition Porter framework assumes • industry structure drives competitive behavior • Industry structure is stable. But---competition also changes industry structure Schumpeterian Competition: A “perennial gale of creative destruction” where innovation overthrows established market leaders Hypercompetition: “intense and rapid competitive moves….creating disequilibrium through continuously creating new competitive advantages and destroying, obsoleting or neutralizing opponents’ competitive advantages
Applying Five Forces to Emerging E-commerce Markets • The more unstable is industry structure—the less • helpful is analysis based upon industry structure. • Taking account of time—willingness to endure losses • today in order to reap profit tomorrow • General structural features of digital, networked • industries: • Low entry barriers + Extreme scale economies + • Network externalities = Winner-take-all markets • = Intense competition
Identifying Key Success Factors Pre-requisites for success Pre-requisites for success What do customers want? How does the firm survive competition • Analysis of competition • What drives competition? • What are the main dimensions of competition? • How intense is competition? • How can we obtain a superior competitive position? • Analysis of demand • Who are our • customers? • What do they want? • What drives competition? • What are the main • dimensions of competition? • How intense is competition? • How can we obtain a • superior competitive position? KEY SUCCESS FACTORS
Identifying Key Success Factors Through Modeling Profitability: The Airline Industry Profitability = Yield x Load factor - Unit Cost Income Revenue RPMs Expenses ASMs RPMs ASMs ASMs = x - • Strength of competition on routes. • Responsiveness to cha- anging market conditions • % business travelers. • Achieving differentia- tion advantage • Price • competitiveness. • Efficiency of route • planning. • Flexibility and • responsiveness. • Customer loyalty. • Meeting customer • requirements. • Wage rates. • Fuel • efficiency of • planes. • Employee • productivity. • Load factors. • Administrative • overhead. ASM = Available Seat Miles RPM = Revenue Passenger Miles
Identifying Key Success Factors by Analyzing Profit Drivers: Retailing Sales mix of products Return on Sales Avoiding markdowns through tight inventory control Max. buying power to minimize cost of goods purchased ROCE Max. sales/sq. foot through: *location *product mix *customer service *quality control Sales/Capital Employed Max. inventory turnover through electronic data interchange, close vendor relationships, fast delivery Minimize capital deployment through outsourcing & leasing
SUMMARY: What Have We Learned? Forecasting Industry Profitability • Past profitability a poor indicator of future profitability. • If we can forecast changes in industry structure we can predict likely impact on competition and profitability. • Strategies to Improve Industry Profitability • What structural variables are depressing profitability? • Which can be changed by individual or collective strategies? • Defining Industry Boundaries • Key criterion: substitution • Working at different levels of aggregation
SUMMARY (continued) • Game Theory • Valuable in analyzing competitive rivalry between small number of players • Analysis of cooperation & competition • Offers insights into the structure of the game; competitive interaction; use of specific strategic plays. • Key Success Factors • Starting point for the analysis of competitive advantage • Industry Analysis & The New Economy • Porter 5 forces analysis less useful when industry structure unstable • Key to understanding digital, networked markets is to understand their underlying structure (esp. scale economies and network externalities)
Industry Evolution OUTLINE • The industry life cycle • Industry structure, competition, and success factors over the life cycle. • Anticipating and shaping the future.
The Industry Life Cycle Drivers of industry evolution : • demand growth • creation and diffusion of knowledge Industry Sales Introduction Growth Maturity Decline Time
Product and Process Innovation Over Time Product Innovation Process Innovation Rate of innovation Time
Standardization of Product Features in Autos FEATURE INTRODUCTION GENERAL ADOPTION Speedometer 1901 by Oldsmobile Circa 1915 Automatic transmission1st installed 1904 Introduced by Packard as an option, 1938. Standard onCadillacs early 1950s Electric headlamps GM introduces, 1908 Standard equipment by 1916 All-steel body GM adoptes 1912 Standard by early 1920s All-steel enclosed body Dodge, 1923 Becomes standard late 1920s Radio Optional extra 1923 Standard equipment, 1946 Four-wheel drive Appeared 1924 Only limited availability by 1994 Hydraulic brakes Introduced 1924 Became standard 1939 Shatterproof glass 1st used 1927 Standard features in Fords 1938 Power steering Introduced 1952 Standard equipment by 1969 Antilock brakes Introduced 1972 Standard on GM cars in 1991 Air bags GM introduces, 1974 By 1994 most new cars equipped with air bags
How Typical is the Life Cycle Pattern? • Technology-intensive industries (e.g. pharmaceuticals, semiconductors, computers) may retain features of emerging industries. Individual products do not. • Other industries (especially those providing basic necessities, e.g. food processing, construction, apparel) reach maturity, but not decline. • Industries may experience life cycle regeneration. Sales Sales 1900 ‘50 ‘60 ‘90 1930 50 60 90 MOTORCYCLES TV’s • Life cycle model can help us to anticipate industry evolution—but dangerous to assume any common, pre-determined pattern of industy development. Tools, Complexity Color Portable B&W HDTV ?
Evolution of Industry Structure over the Life Cycle INTRODUCTION GROWTH MATURITY DECLINE DEMAND Affluent buyers Increasing Mass market Knowledgeable, penetration replacement customers, resi- demand dual segments TECHNOLOGY Rapid product Product and Incremental Well-diffused innovation process innovation innovation technology PRODUCTS Wide variety, Standardization Commoditiz- Continued rapid design change ation commoditization MANUFACT- Short-runs, skill Capacity shortage, Deskilling Overcapacity URING intensive mass-production TRADE -----Production shifts from advanced to developing countries----- COMPETITION Technology- Entry & exit Shakeout & Price wars, consolidation exit (p. 315) KSFs Product innovation Process techno- Cost efficiency Overhead red- logy. Design for uction, ration- alization, low cost sourcing
The Driving Forces of Industry Evolution BASIC CONDITIONS INDUSTRY STRUCTURE COMPETITION Customers become more knowledgeable & experienced Customers become more price conscious Quest for new sources of differentiation Products become more standardized Diffusion of technology Price competition intensifies Production becomes less R&D & skill-intensive Production shifts to low-wage countries Excess capacity increases Bargaining power of distributors increases Demand growth slows as market saturation approaches Distribution channels consolidate
Preparing for the Future : The Role of Scenario Analysis in Adapting to Industry Change Stages in undertaking multiple Scenario Analysis: • Identify major forces driving industry change • Predict possible impacts of each force on the industry environment • Identify interactions between different external forces • Among range of outcomes, identify 2-4 most likely/ most interesting scenarios: configurations of changeforces and outcomes • Consider implications of each scenario for the company • Identify key signposts pointing toward the emergence of each scenario • Prepare contingency plan Tool, POA, Option Value
Innovation & Renewal over the Industry Life Cycle: Retailing Warehouse Clubs e.g. Price Club Sam’s Club Internet Retailers e.g. Amazon; Webvan Discount Stores e.g. K-Mart Wal-Mart “Category Killers” e.g. Toys-R-Us, Home Depot Mail order, catalogue retailing e.g. Sears Roebuck Chain Stores e.g. A&P 1880s 1920s 1960s 2000
Review: New tools. Use Insights from to develop POA • 4 C’s, PEST • 5 Forces => Market Attractiveness, can combine w/ Competitive Strength => Corporate Strategy • Key Success Factors • Life Cycle • Scenarios, option value • Value Equivalence Line - next • Strategic Groups & competing w/in and between, p. 127 - 129
BCG’s Strategic Environments Matrix FRAGMENTED SPECIALIZATION apparel, housebuilding pharmaceuticals, luxury cars jewelry retailing, sawmills chocolate confectionery STALEMATE VOLUME basic chemicals, volume jet engines, food supermarkets grade paper, ship owning motorcycles, standard (VLCCs), wholesale banking microprocessors Many SOURCES OF ADVANTAGE Few Big Small SIZE OF ADVANTAGE
BCG’s Analysis of the Strategic Characteristics of Specialization Businesses CREATIVE EXPERIMENTAL fashion, toiletries, magazines general publishing food products PERCEPTIVE ANALYTICAL high tech luxury cars, confectionery paper towels low ABILITY TO SYSTEMATIZE high high low ENVIRONMENTAL VARIABILITY