Download
1 / 44
440 likes | 561 Views
Assessment of metal loads by tracer injection and synoptic sampling in the Lefthand Creek watershed, Boulder County, Colorado. Alice Wood, Roshan Cholas, Laura Harrington, Lily Isenhart, Ned Turner, and Joe Ryan . Overview. Background Methods Results. Background. Study area.

E N D
Assessment of metal loads by tracer injection and synoptic sampling in the Lefthand Creek watershed, Boulder County, Colorado Alice Wood, Roshan Cholas, Laura Harrington, Lily Isenhart, Ned Turner, and Joe Ryan
Overview • Background • Methods • Results
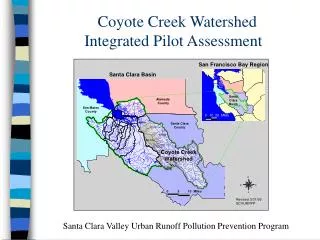
Study area • Mountainous watershed • Drains 220 km2 • Elevation range from 4,200 m at the glacial headwaters near the Continental Divide to 1,400 m at the confluence with the St. Vrain Creek in Longmont, CO • Located at the northern tip of the Colorado Mineral Belt Lefthand Watershed Task Force Report, 2002
Site History • Hundreds of mines and mills operated in the mid-1800s—late 1900s • Brought settlers to the area • Traditional mining practices involved abandoning sites when they were no longer profitable, and moving on to a new area.
Site History • Today’s legacy: acid mine drainage and metal contamination from mines and waste rock
2FeS2(s) + 7O2(aq) + 2H2O → 2Fe2+ + 4SO42- + 4H+ • 2Fe2+ + ½O2 + 2H+ → 2Fe3+ + H2O • 2Fe3+ + 6H2O ↔ 2Fe(OH)3(s) + 6H+ • 14Fe3+ + FeS2(s) + 8H2O → 2SO42- + 15Fe2+ + 16H+ AMD Chemistry • The interaction of sulfide minerals, generally pyrite, with oxygen and water generates sulfuric acid
Modern Concerns • Primary water supply to 14,000 customers of the Left Hand Water District • Threat of toxic release to drinking and agricultural water supply • Aquatic life toxicity • Fish kills, impaired habitat • TMDL listings
Remedial actions • Current remedial activities: • the Captain Jack Mine and Mill Superfund Site • Honeywell voluntary cleanup of the Burlington Mine • the development of a watershed-scale remediation plan by a local stakeholder group • In the Lefthand Creek watershed, an understanding of toxic metal sources, transport, and fate is necessary to prioritize contaminated sites and develop efficient cleanup strategies.
Research Goal and Hypothesis • Goal: Identify and quantify sources of metal loading to Lefthand, James, and Little James Creeks. • Hypothesis: Metal loading tracer tests and synoptic sampling (Kimball, 1997; Kimball et al, 2001) can be applied in series to analyze changes in stream flow and metal concentrations with high spatial resolution throughout the Lefthand Creek watershed.
Tracer Tests • Conservative tracer (LiCl, NaCl) of a known concentrations is pumped into the stream at a known, constant rate • According to mass balances, dilution by inflowing stream water reduces the tracer concentration at downstream sites. • Stream discharge is calculated according to: Kimball, 1997
Tracer solution Injection pump Stream Sampling and monitoring
Tracer tests • Monitored [Li] and conductivity at four sites • Tracer injection tank • Monitor [Li] changes, obtain average tracer [Li] • Upstream of injection • Monitor [Li] changes, obtain background [Li] • Downstream of injection • Observe leading edge of tracer injection solution • Downstream end of study reach • Observe arrival of tracer at most downstream sampling site
Tracer tests • The tracer is pumped into the stream continuously throughout the test. • Sampling does not begin until the tracer reaches a “steady state” through the entire stream reach. • Added a pulse of NaCl to the stream before beginning the LiCl injection • NaCl spikes the downstream conductivity • Provides measurable indication of the arrival of LiCl at the most downstream sampling site
Synoptic Sampling • Collection of stream water samples at spatially frequent locations during the tracer injection period • Collected both in-stream and tributary samples • These samples provide a “snapshot in time” of tracer and metal concentrations in the stream • Allows for stream discharge calculations for each sample site • Discharge and concentration data allow for load calculations for each sample site
N Little James Creek Jamestown James Creek Hwy 36 Hwy 72 Rowena Ward Creek 7/02/02 7/18/02 4/22/03 5/21/03 Lefthand 5/27/03 5/29/03 6/05/03 6/10/03 6/12/03 I km Synoptic Sampling I km I km
Laboratory Procedures and Analysis • All synoptic samples were analyzed for pH in the lab within 24 hours of collection • ~ 30 mL of each synoptic sample was filtered through hydrophilic nylon syringe filters • 0.45 μm or 0.2 μm diameter pore size • All samples were acidified to a pH < 2 with trace-metal grade nitric acid for preservation • Metal analysis was performed with ICP-AES and ICP-MS
Definitions • We apply the following definitions for our study: • Total metals – The metal concentrations measured in the unfiltered synoptic samples • Dissolved metals – The metal concentrations measured in the filtered synoptic samples • Colloidal metals – The metal concentrations calculated by taking the difference of total and dissolved metal concentrations • [MeC] = [MeT] – [MeD]
Load calculations • Metal loads in a stream are the product of the stream discharge and metal concentrations. • Reported in g/day or mol/day • Loads were calculated for each synoptic sample site • Fe, Al, Mn, Zn, Cu, Pb, Ca • Total, dissolved, colloidal • Downstream load increases indicate an increase in stream discharge, an increase in metal concentrations, or both
Hardness and Standards • CDPHE Table Values Standards (TVS) were compared to the measured dissolved metal concentrations. • TVS are based on water hardness • Hardness = the sum of calcium (Ca) and magnesium (Mg) concentrations • expressed as mg/L CaCO3 • Calculated for 4—5 sites along each stream reach
Discharge – Little James Creek 4/22/03 – High Flow 6/17/03 – Low Flow
Metal Sources – Lefthand Creek • California Gulch • Big Five, Captain Jack, White Raven Sites • “Lee Hill” Gulch • Ephemeral (?) tributary at approximately 19.4 km downstream
Metal sources – James Creek • Most sources are in the Upper James Creek (upstream of Jamestown) • John Jay Mine • Fairday Mine • Unknown sources: 2.5 km and 4.8 km • The Little James Creek brings is the largest contributor to the James Creek • The Golden Age Mine may be contributing lead upstream of the James-Lefthand Confluence
Metal sources – Little James Creek • Present during both high and low flow sampling events • Balarat Creek • Emmit Adit • Present only during high flow event • Unnamed tributary near the Streamside Tailings area
Acknowledgements • Many thanks to all of the organizations who helped to fund this research: • CU Outreach Program • Undergraduate Research Opportunity Program (UROP) • Research Experience for Undergraduates (REU) • University Government of Graduate Students • Thanks to the Geology L.E.G.S. lab for analysis • And especially to the individuals who offered their time and expertise: • Dr. Joe Ryan, Lily Isenhart, Roshan Cholas, Marc Cittone, Michael Costanzo, Nicole Denovio, Laura Harrington, Tracy Kirkland, Kim Raby, Emily Schneider, and Ned Turner.